Last updated on February 4, 2026
Azure Monitor Cheat Sheet
- Monitoring tool for your Azure resources and applications.
- A service to display the metrics of your resources. You can also configure alerts that send notifications when a threshold is breached.
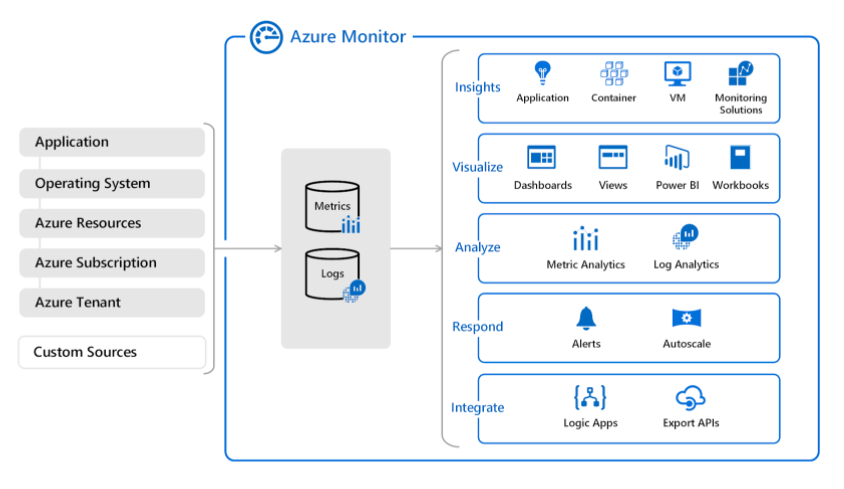
Features
- Metrics represents a time-ordered set of data points that are published to Azure Monitor.
- The metrics collected are stored for a maximum of 93 days.
- Share your dashboards with other users using Azure Dashboards.
- The data is stored as a set of records in either the Log Analytics or Application Insights.
- You may use log analytics to collect and store the data from various log sources and use a custom query language to query them.
- Application Insights helps you detect and diagnose issues across applications and dependencies.
- When important conditions are found in your monitoring data, you can create an alert rule to identify and address issues.
- You can export basic usage metrics from your CDN endpoint with diagnostic logs.
- To connect Azure to a supported IT Service Management (ITSM) product or service, you need to use an ITSM Connector (ITSMC).
- ITSMC supports connections to the following ITMS tools: Cherwell, Provance, ServiceNow, and System Center Service Manager.
- You can create visualizations using Azure Monitor dashboards for Grafana, which is now generally available alongside Azure Dashboards.
- Granular role-based access control (RBAC) for Log Analytics workspaces is now generally available for more precise permissions.
Log Analytics
- All log data obtained by Azure Monitor shall be stored in a Log Analytics workspace
- Query simple to advanced logs.
- The data is retrieved from a workspace using a log query written using Kusto Query Language (KQL).
- The queries that you can run are:
- Table-based queries – the query organizes log data into tables.
- Search queries – use this query if you need to find a specific value in your table.
- Sort and top – to display the results in a particular order, you must sort the preferred column. To get the latest records in the entire table, you can use top.
- Where – this operator allows you to add a filter to a query. You can use different expressions when writing filter conditions.
- Time filter in query – you can define a specific time range by adding the time filter to the query.
- Project and Extend – project allows you to select specific columns and extend will add additional columns.
- Summarize – you can identify a group of records and apply aggregations using the summarize operator.
- If the query includes workspaces in 20 or more regions, your query will be blocked from running.
- Log Analytics results are limited to a maximum of 10,000 records.
- With the Azure Monitor Agent (AMA), you can collect logs and performance data from virtual or physical devices. The older Log Analytics Agent is deprecated. AMA uses data collection rules (DCRs) for configuration.
- A reorganized Log Analytics REST API reference provides a clearer guide for log-related APIs.
- You can configure Azure Monitor with a Network Security Perimeter for enhanced network-level access control.
Azure Monitor Insights
Pre-configured monitoring solutions for specific Azure services:
- VM Insights: Monitor the performance, health, and running processes of virtual machines and virtual machines scale sets.
- Container Insights: Provide a comprehensive view of the performance, health, and utilization of container workloads in Azure Container Instances or clusters hosted on Azure Kubernetes Service.
- Storage Insights: Monitor the performance, capacity, and availability of storage accounts.
- Network Insights: Monitor the health and metrics of all network resources.
- Key Vault Insights: Provide a unified view of all Azure Key Vaults’ requests, failures, operations, and latency.
- Cosmos DB Insights: Monitor the overall performance, capacity, failures, and operational health of all Azure Cosmos DB resources and Azure Cache for Redis.
Application Insights
- Enables you to monitor custom events and metrics.
- Monitor diagnostic trace logs from your application.
- You can identify performance anomalies, diagnose issues, and understand user activities in live applications.
- The primary method for instrumenting applications is now OpenTelemetry. Use connection strings instead of the older instrumentation keys.
- The OpenTelemetry distribution automatically collects system performance counters and supports rate-limited sampling.
- SDK Stats is a preview feature to help diagnose missing telemetry.
- OpenTelemetry collection for Azure Functions is now generally available.
- Azure Monitor Managed Service for Prometheus
- This is a core service for collecting and analyzing Prometheus-style metrics from Kubernetes and cloud-native environments.
- Azure Operations Center
- A new unified operations management plane, currently in gated public preview.
Azure Monitor Pricing
- You pay for the ingestion and retention of data in Log Analytics (per GB/month).
- You are billed for the number of metrics you have per month.
- There are no charges for health criteria alerts.
Want to learn more about Azure? Watch the official Microsoft Azure YouTube channel’s video series called Azure Tips and Tricks.
Validate Your Knowledge
Question 1
Question Type: Single choice
Your company has an Azure Log Analytics workspace in their Azure subscription.
You are instructed to find the error in the table named EventLogs.

Which log query should you run in the workspace?
search in (EventLogs) "error"EventLogs | take 10search "error"EventLogs | sort by TimeGenerated desc
Correct Answer: 1
Azure Monitor is a service in Azure that provides performance and availability monitoring for applications and services in Azure, other cloud environments, or on-premises. Azure Monitor collects data from multiple sources into a common data platform where it can be analyzed for trends and anomalies. Rich features in Azure Monitor assist you in quickly identifying and responding to critical situations that may affect your application.

To retrieve data in the Log Analytics workspace, you need to use a Kusto Query Language (KQL). Remember that there are different types of log queries in Azure Monitor. Based on the given question, you only need to find the “error” in the table named “EventLogs.”
With search queries, you can find the specific value that you need in your table. This query searches the “TableName” table for records that contains the word “value”:
search in (TableName) "value"
If you omit the “in (TableName)“ part and just run the search "value", the search will go over all tables, which would take longer and be less efficient.
Hence, the correct answer is: search in (EventLogs) "error".
The option that says: EventLogs | take 10 is incorrect because this option would only take 10 results in the EventLogs table. Remember that the requirement in the scenario is to show all the logs containing the word “error” in the table named EventLogs.
The option that says: search "error" is incorrect because this query would search “error” in all the tables. Take note that you only need to query the table EventLogs.
The option that says: EventLogs | sort by TimeGenerated desc is incorrect because this query will only sort the entire EventLogs table by the TimeGenerated column.
References:
https://docs.microsoft.com/en-us/azure/azure-monitor/log-query/get-started-queries
https://docs.microsoft.com/en-us/azure/azure-monitor/log-query/log-analytics-tutorial
Note: This question was extracted from our AZ-104 Microsoft Azure Administrator Practice Exams.
For more Azure practice exam questions with detailed explanations, check out the Tutorials Dojo Portal:
Azure Monitor References:
https://docs.microsoft.com/en-us/azure/azure-monitor/overview
https://azure.microsoft.com/en-us/services/monitor/
🔥 43% OFF AWS & Azure Pro-Level Reviewers
Turn Your Team Into Cloud-Ready Professionals Today

Learn AWS with our PlayCloud Hands-On Labs
$2.99 AWS and Azure Exam Study Guide eBooks

New Claude Certified Architect Foundations CCA-F

Learn GCP By Doing! Try Our GCP PlayCloud

Learn Azure with our Azure PlayCloud
FREE AI and AWS Digital Courses

FREE AWS, Azure, GCP Practice Test Samplers

Subscribe to our YouTube Channel

Follow Us On Linkedin