Last updated on July 10, 2026
Amazon Quick Cheat Sheet
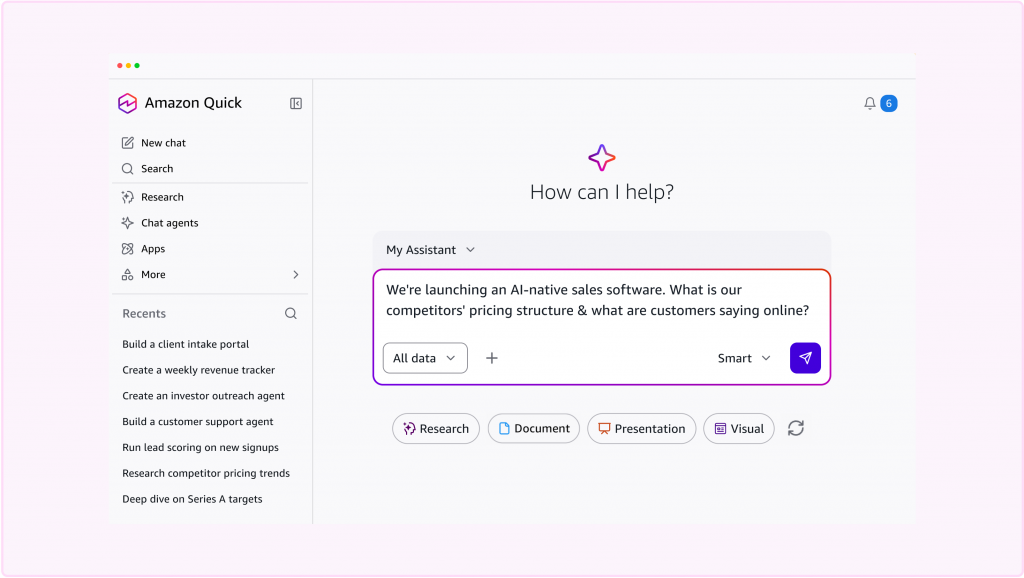
Amazon Quick is an AI-powered service for automating tasks, analyzing data, building web applications, and conducting research. You interact with Quick through natural language chat, and Quick uses AI agents to process your requests against connected data sources and applications.
Features
-
- Amazon Quick Sight: Interactive data visualization and business intelligence. Connect to data sources, build dashboards, and embed analytics in applications.
- Amazon Quick Flows: Automate repetitive tasks with AI-powered workflows that use your data and take actions in connected applications.
- Amazon Quick Automate: Build business process automations with AI agents that make contextual decisions and execute actions across applications.
- Amazon Quick Index: Connect your organization’s documents and data sources so AI responses are grounded in your information.
- Amazon Quick Research: Conduct in-depth research across the web and your data, delivered as a cited report.
- Apps in Amazon Quick: Build interactive web applications by describing what you need in natural language.
- Everything in one place: Agents, research, automation, analytics, and app building are all built in.
- Fully managed: No infrastructure to provision, no models to host, no ML expertise required.
- Connects to your tools and data: Integrates with databases, systems, and applications through knowledge bases, action connectors, extensions, and structured data connections. Open standards including Model Context Protocol (MCP) and OpenAPI let you connect any system.
- Meets you where you work: Use Quick from the web, the desktop application, or directly inside Chrome, Slack, Microsoft Teams, and Microsoft 365 applications.
- AI you can trust: Runs on AWS with the same identity, network, and compliance controls your security team already approved. Your data stays in your control.
Amazon Quick Sight (formerly QuickSight)
Note: Amazon Quick evolved from Amazon QuickSight. QuickSight continues as Amazon Quick Sight, a feature within Quick. All existing QuickSight APIs, SDKs, and integrations continue to work without changes.
-
- Uses a combination of columnar storage, in-memory technologies.
- Data in SPICE is persisted until it is explicitly deleted by the user.
- SPICE also automatically replicates data for high availability and enables QuickSight to scale easily.
- The SPICE engine supports data sets up to 250M rows and 500GB.
Amazon Quick Sight Concepts
- A QuickSight Author is a user who can connect to data sources (within AWS or outside), create interactive dashboards using advanced QuickSight capabilities, and publish dashboards with other users in the account.
- A QuickSight Reader is a user who uses interactive dashboards. Readers can log in via QuickSight username/password, SAML portal or AD auth, view shared dashboards, filter data, drill down to details, or export data as a CSV file.
- Readers can be easily upgraded to authors via the QuickSight user management options.
- Readers with pay-per-session pricing only exist in Enterprise Edition. Standard Edition accounts can be easily upgraded to Enterprise.
- A QuickSight Admin is a user who can manage QuickSight users and account-level preferences, as well as purchase SPICE capacity and annual subscriptions for the account.
- Admins have all QuickSight authoring capabilities.
- Admins can also upgrade Standard Edition accounts to Enterprise Edition.
- QuickSight Authors and Readers can be upgraded to Admins at any time.
- A QuickSight Reader session has a 30-minute duration and is renewed at 30-minute intervals. The session starts with a user-initiated action (login, dashboard load, page refresh, drill-down, or filtering).
- Dashboards are a collection of visualizations, tables, and other visual displays arranged and visible together.
- Stories are guided tours through specific views of analysis. They are used to convey key points, a thought process, or the evolution of an analysis for collaboration.
-
- Amazon Quick Sight (BI & Analytics)
- Data preparation: Transform raw data for use in analysis. Upload XLSX, CSV, TSV, CLF, XLF files directly or connect to data sources.
- Visuals: Graphical representations of data (charts, graphs, tables). AutoGraph automatically selects visualization based on selected fields.
- Analyses: Basic workspace for creating and interacting with visuals.
- ML Insights: ML-powered anomaly detection, forecasting, and auto-narratives.
- SPICE engine: Super-fast, parallel, in-memory calculation engine with columnar storage. Data is persisted until explicitly deleted. Supports data sets up to 250M rows and 500GB.
- Row-level security: Control access to data at row granularity based on user permissions.
- Security
- Offers role-based access control, Active Directory integration, CloudTrail auditing, single sign-on, private VPC subnets, and data backup.
- FedRamp, HIPAA, PCI PSS, ISO, and SOC compliant.
- Row-level security enables QuickSight dataset owners to control access to data at row granularity based on permissions associated with the user interacting with the data.
- Pricing
- Amazon Quick offers two ways to get started:
- Free and Plus accounts: Sign up at aws.com/quick using your email or social credentials (Google, Apple, Amazon, GitHub). No AWS account required. Choose from Free, Free Trial Plus, or Paid Plus plan tiers.
- AWS Console accounts: If your organization uses AWS, provision Quick through the AWS Management Console. Uses IAM Identity Center for authentication and integrates with your existing AWS billing and governance.
- For current pricing details, refer to the official Amazon Quick pricing page.
- Amazon Quick offers two ways to get started:
- Amazon Quick Sight (BI & Analytics)
Note: If you are studying for the AWS Certified Data Engineer Associate exam, we highly recommend that you take our AWS Certified Data Engineer Associate Practice Exams and read our Data Engineer Associate exam study guide.

Validate Your Knowledge
Question 1
A Data Analyst uses Amazon QuickSight for management reporting and wants to accurately present the company’s monthly sales revenue trend for the past three years. The raw data will come from several CSV files in an Amazon S3 bucket. In turn, the analyst needs to aggregate and process its data before it gets transferred to a visual dashboard.
Which solution can achieve these requirements in the fastest manner?
- Write an AWS Lambda function that inserts the CSV records into an Amazon RDS for MySQL instance. Configure QuickSight to connect to the RDS. Use a Combo Chart Visual Type for Amazon QuickSight.
- Set up an Amazon Athena table that processes the data in the CSV files. Configure QuickSight to connect to the S3 bucket and Athena. Use a Line Chart Visual Type for Amazon QuickSight.
- Set up an Amazon Athena table that processes the data in the CSV files. Configure QuickSight to connect to the S3 bucket and Athena. Use a Donut Chart Visual Type for Amazon QuickSight.
- Use a
COPYcommand to load the data from the CSV files into a table in an Amazon Redshift Cluster. Configure QuickSight to connect to the Redshift cluster. Use a Heat Map Chart Visual Type for Amazon QuickSight.
Correct Answer: 2
Amazon QuickSight supports various data sources, including Amazon S3, Amazon Athena, Amazon RDS, and Amazon Redshift, that you can use to provide data for analyses. A dataset identifies the specific data in a data source that you want to use. For example, the data source might be a table if you connect to a database data source. QuickSight offers you various visual types to present the insight that the target audience can immediately understand. Combo Charts and Line Charts are ideal for illustrating trends and movements over a specific timeline. Donut Charts are useful to show a percentage of the total amount. Heat Maps help to easily track outliers, magnitudes, and trends in two dimensions.

Since the files are already in a supported format (CSV) and are located in an S3 bucket, QuickSight can readily extract that data from the bucket. However, the data analyst need to aggregate and process these files before it moves to QuickSight, and hence, the fastest solution that can achieve this is the option that says: Set up an Amazon Athena table that processes the data in the CSV files. Configure QuickSight to connect to the S3 bucket and Athena. Use a Line Chart Visual Type for Amazon QuickSight.
The option that says: Write an AWS Lambda function that inserts the CSV records into an Amazon RDS for MySQL instance. Configure QuickSight to connect to the RDS. Use a Combo Chart Visual Type for Amazon QuickSight is incorrect. Since the CSV files are already stored in an S3 bucket, you can just use Amazon Athena for data extraction. There’s not a need to provision an RDS instance and write a Lambda function as these require additional configuration.
The option that says: Set up an Amazon Athena table that processes the data in the CSV files. Configure QuickSight to connect to the S3 bucket and Athena. Use a Donut Chart Visual Type for Amazon QuickSight is incorrect. Since the dashboard emphasizes a dimension over time, a Line or Combo Chart is a more effective tool to present data.
The option that says: Use a COPY command to load the data from the CSV files into a table in an Amazon Redshift Cluster. Configure QuickSight to connect to the Redshift cluster. Use a Heat Map Chart Visual Type for Amazon QuickSight is incorrect. Although this is possible, the scenario is mostly concerned about setting up a solution as fast as possible. Redshift beats Athena in terms of performance, but Athena is more flexible and portable, thus, you can create a solution a lot faster by using Amazon Athena.
References:
https://aws.amazon.com/blogs/big-data/build-a-schema-on-read-analytics-pipeline-using-amazon-athena/
https://docs.aws.amazon.com/quicksight/latest/user/data-sets-based-on-multiple-s3-files.html

Note: This question was extracted from our AWS Certified Data Analytics Specialty Practice Exams.
For more AWS practice exam questions with detailed explanations, visit the Tutorials Dojo Portal:

Amazon Quick Cheat Sheet Reference:
https://docs.aws.amazon.com/quick/latest/userguide/what-is.html
🔥 43% OFF AWS & Azure Pro-Level Reviewers
Turn Your Team Into Cloud-Ready Professionals Today

Learn AWS with our PlayCloud Hands-On Labs
$2.99 AWS and Azure Exam Study Guide eBooks

New Claude Certified Architect Foundations CCA-F

Learn GCP By Doing! Try Our GCP PlayCloud

Learn Azure with our Azure PlayCloud
FREE AI and AWS Digital Courses

FREE AWS, Azure, GCP Practice Test Samplers

Subscribe to our YouTube Channel

Follow Us On Linkedin