Last updated on June 5, 2023
Monitoring logs efficiently is essential in today’s fast-paced and data-centric world, especially for cloud-based applications and services. Amazon Web Services (AWS) provides a robust solution called CloudWatch Logs, which enables centralized log monitoring, analysis, and management. One of the key functionalities of CloudWatch Logs is the ability to filter logs effectively using metric filters and receive notifications through Amazon Simple Notification Service (SNS). This combination empowers users to streamline log analysis, identify critical events, and take proactive measures to ensure smooth application operation.

Understanding CloudWatch Logs
Before delving into the details of using metric filters and SNS notifications, let’s gain a basic understanding of CloudWatch Logs. It is an AWS service designed to store, monitor, and analyze log data efficiently. It accepts logs from various AWS resources like EC2 instances, Lambda functions, ECS containers, and even custom logs generated by applications.
CloudWatch Logs organizes log data into log groups, acting as containers for related log streams. Each log stream represents a sequence of log events from the same source. For instance, an “application_logs” log group may contain multiple log streams, each representing a different component of the application.
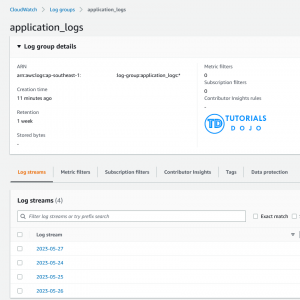
Once logs are ingested into CloudWatch Logs, users can perform searches, apply filters, and analyze them using CloudWatch Logs Insights. Furthermore, integration with other AWS services allows for advanced processing and visualization capabilities.
Leveraging Metric Filters
Metric filters in CloudWatch Logs serve the purpose of extracting and transforming log data into numerical values, which can be utilized as metrics. By defining metric filters, users can extract meaningful information from logs and gain insights into specific patterns or events.
For example, imagine having a log group with application logs and the need to monitor the occurrence of a specific error message. A metric filter can be created to extract the relevant information and count the number of times the error message appears. These transformed metrics can then be utilized to trigger alarms, create dashboards, or perform other necessary actions.
Creating Metric Filters
Efficient log monitoring involves filtering out noise and focusing on relevant events. Metric filters in CloudWatch Logs allow users to precisely define the log events they wish to capture based on patterns, values, or a combination of both.
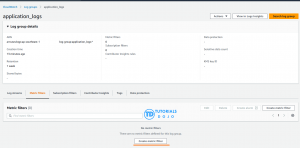
When creating a metric filter, a filter pattern is specified to match desired log events. The filter pattern can include predefined keywords, custom values, wildcards, and operators. Users have the flexibility to fine-tune filter patterns according to their requirements.
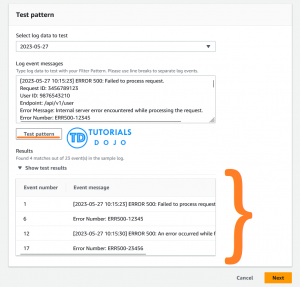
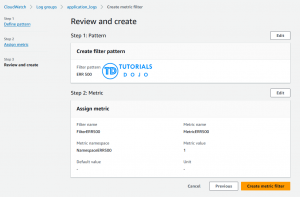
For instance, suppose there is a need to create a metric filter that captures all HTTP 500 errors in application logs. The filter pattern could resemble the following:
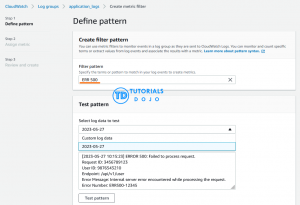
This pattern matches log events containing an error message and a status code of 500. By extracting this information as a metric, users gain visibility into the frequency and distribution of these errors.
Configuring SNS Notifications
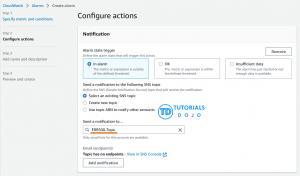
Once metric filters are set up to extract meaningful metrics from log data, the next step involves configuring notifications to alert users when specific thresholds or conditions are met. Amazon SNS, a fully managed pub/sub messaging service, facilitates the delivery of notifications to various endpoints such as email, SMS, mobile push, etc.
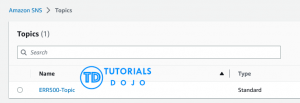
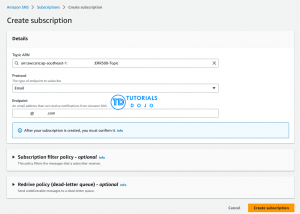
To configure SNS notifications for CloudWatch Logs, users need to create an SNS topic and subscribe to it. The SNS topic acts as the communication channel between CloudWatch and the desired endpoint(s). Multiple subscriptions can be created for a single SNS topic, allowing notifications to be sent to different destinations simultaneously.
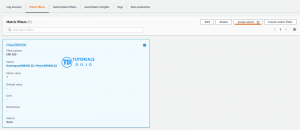
By subscribing an email address, phone number, or even an HTTP(S) endpoint to the SNS topic, users receive notifications whenever log events trigger a metric filter and meet the specified conditions. This real-time alert mechanism ensures users are promptly informed about critical events in their log data.
In summary, efficient log monitoring is crucial for maintaining the reliability and performance of cloud-based applications and services. By leveraging metric filters in Amazon CloudWatch Logs and configuring SNS notifications, users can streamline log analysis, extract valuable insights, and receive real-time alerts about critical events.
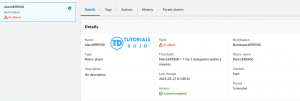
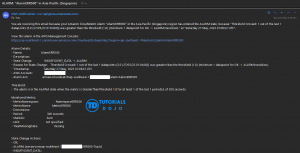
CloudWatch Logs provides a powerful platform for centralizing, searching, and analyzing log data, while metric filters enable the transformation of logs into meaningful metrics. The integration with Amazon SNS empowers users to stay informed and take proactive measures to ensure smooth application operation.
Implementing efficient log monitoring allows for improved troubleshooting, optimized performance, and enhanced reliability of cloud-based infrastructures.


