Managing resources effectively is crucial when operating in the cloud. One important aspect of managing Amazon EC2 instances is monitoring storage and memory usage. Storage space, primarily driven by Amazon Elastic Block Store (EBS), and memory (RAM) are two critical resources that need constant monitoring to avoid performance degradation and optimize costs. Fortunately, with Amazon CloudWatch and Slack, you can automate monitoring these resources and get notified when thresholds are crossed. This blog will guide you through setting up automated monitoring for disk utilization (EBS storage) and memory utilization (RAM) in Amazon EC2 using CloudWatch and Slack.
Difference Between Storage and Memory
Before diving into monitoring, it’s important to understand the distinction between storage and memory.
-
Storage (Disk): This refers to the permanent storage where data is stored long-term. Amazon EBS volumes are used to store data, files, and applications on Amazon EC2 instances. EBS storage is persistent, meaning data will remain even if the instance is stopped or terminated. It’s crucial to monitor the utilization of EBS to ensure that you don’t run out of storage space, which could impact application performance or lead to unexpected downtime.
-
Memory (RAM): This refers to the temporary, volatile memory that is used by the operating system and applications while the instance is running. RAM is where active data is processed, but once the instance is shut down, any data in memory is lost. Unlike EBS storage, memory usage must be constantly monitored to avoid performance bottlenecks or system crashes.
Why Monitor EBS Storage and RAM?
Monitoring EBS storage helps to ensure you don’t run into issues related to disk full errors, which could cause applications to crash or be unable to write data. Similarly, monitoring RAM usage is crucial to ensure your EC2 instance is not running out of memory, which could result in system slowdowns or crashes.
Installing CloudWatch Agent to Monitor Memory Usage (RAM)
By default, CloudWatch only monitors EBS storage and basic EC2 metrics like CPU utilization and network performance. To monitor memory usage on your EC2 instance, you’ll need to install and configure the CloudWatch Agent.
Steps to Install and Configure CloudWatch Agent:
-
Install the CloudWatch Agent:
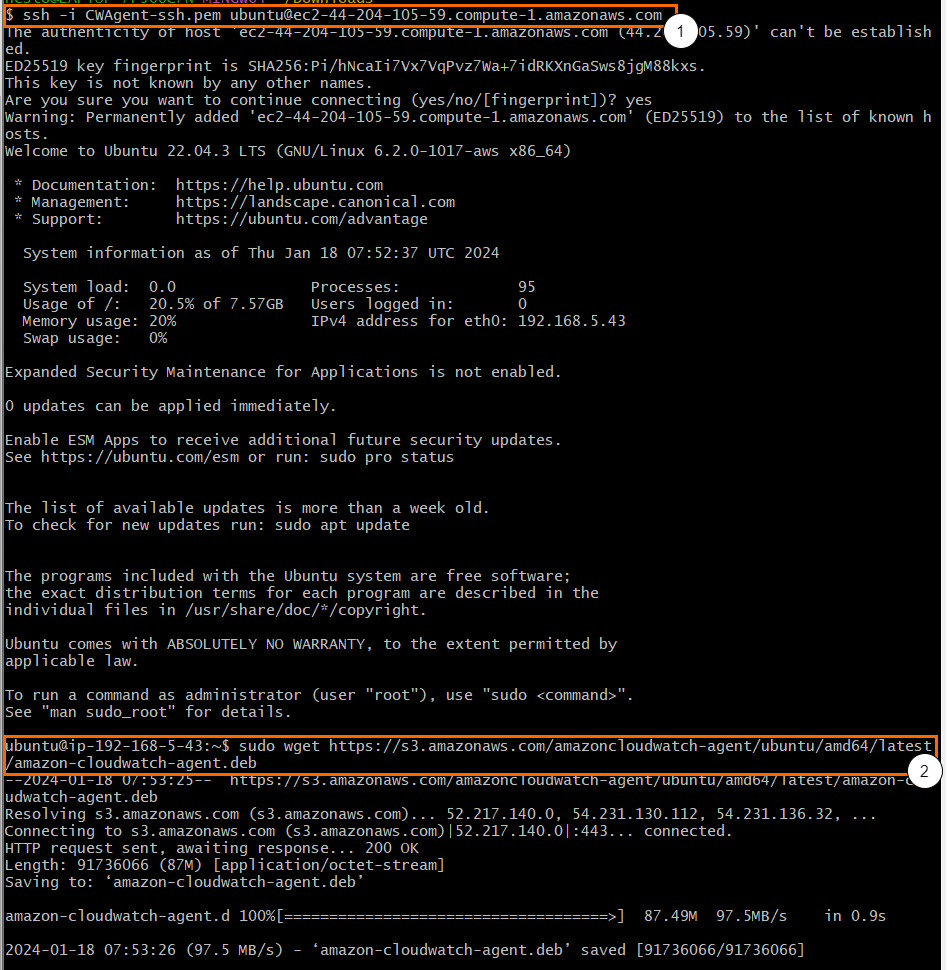
- Connect to your EC2 instance via SSH.
- For Amazon Linux 2, run the following commands to simply download the agent from an S3 bucket to the current directory:
sudo wget https://s3.amazonaws.com/amazoncloudwatch-agent/ubuntu/amd64/latest/amazon-cloudwatch-agent.deb

-
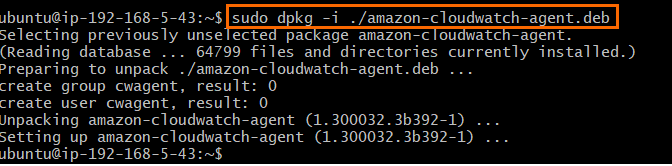
Install the CloudWatch Agent, by running the command below:
sudo dpkg -i ./amazon-cloudwatch-agent.deb

Configure CloudWatch Agent to send custom metrics to CloudWatch
- Edit the agent’s configuration file. Run
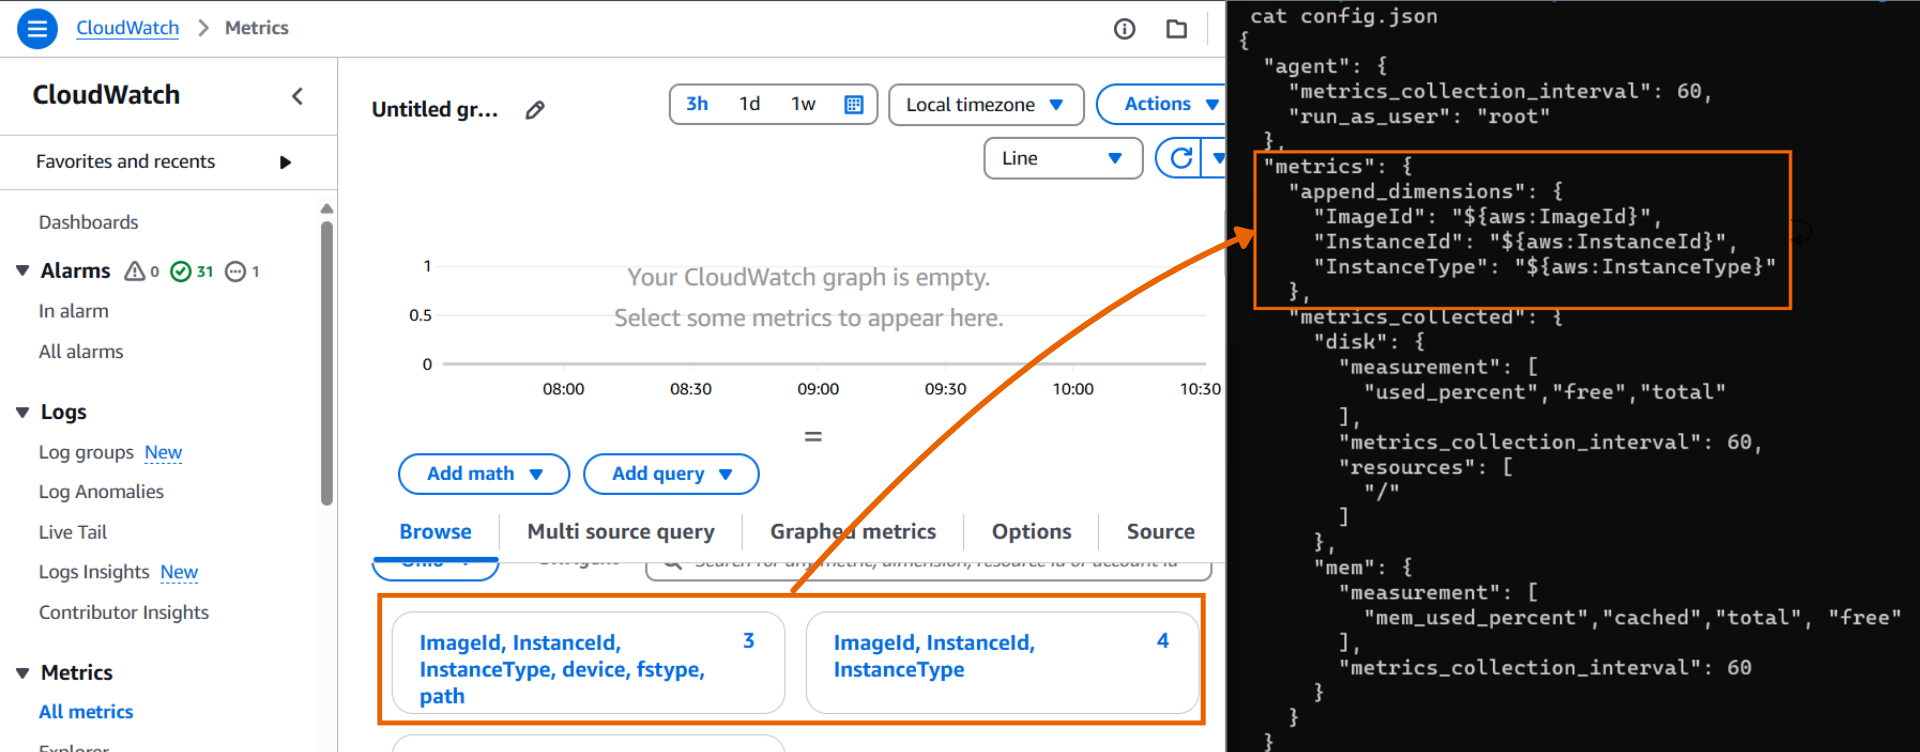
sudo vi /opt/aws/amazon-cloudwatch-agent/bin/config.json. Copy and paste the code below. EnterESC :wq!to save the file.{ "agent": { "metrics_collection_interval": 60, "run_as_user": "root" }, "metrics": { "append_dimensions": { "ImageId": "${aws:ImageId}", "InstanceId": "${aws:InstanceId}", "InstanceType": "${aws:InstanceType}" }, "metrics_collected": { "disk": { "measurement": [ "used_percent" ], "metrics_collection_interval": 60, "resources": [ "/" ] }, "mem": { "measurement": [ "mem_used_percent" ], "metrics_collection_interval": 60 } } } } - Stop and Start the CloudWatch Agent:
- Stop the CloudWatch Agent using the command line.
sudo /opt/aws/amazon-cloudwatch-agent/bin/amazon-cloudwatch-agent-ctl -m ec2 -a stop
- Start the CloudWatch agent using the command line.
sudo /opt/aws/amazon-cloudwatch-agent/bin/amazon-cloudwatch-agent-ctl -a fetch-config -m ec2 -s -c file:/opt/aws/amazon-cloudwatch-agent/bin/config.json
- Stop the CloudWatch Agent using the command line.
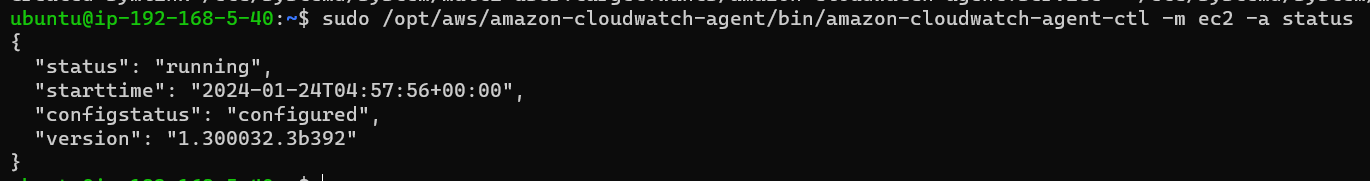
- Validate Agent is Active: Start the agent, check the agent logs, and review the console for server log data and metrics. Run the following commands.
sudo /opt/aws/amazon-cloudwatch-agent/bin/amazon-cloudwatch-agent-ctl -m ec2 -a status

cat /opt/aws/amazon-cloudwatch-agent/logs/configuration-validation.log

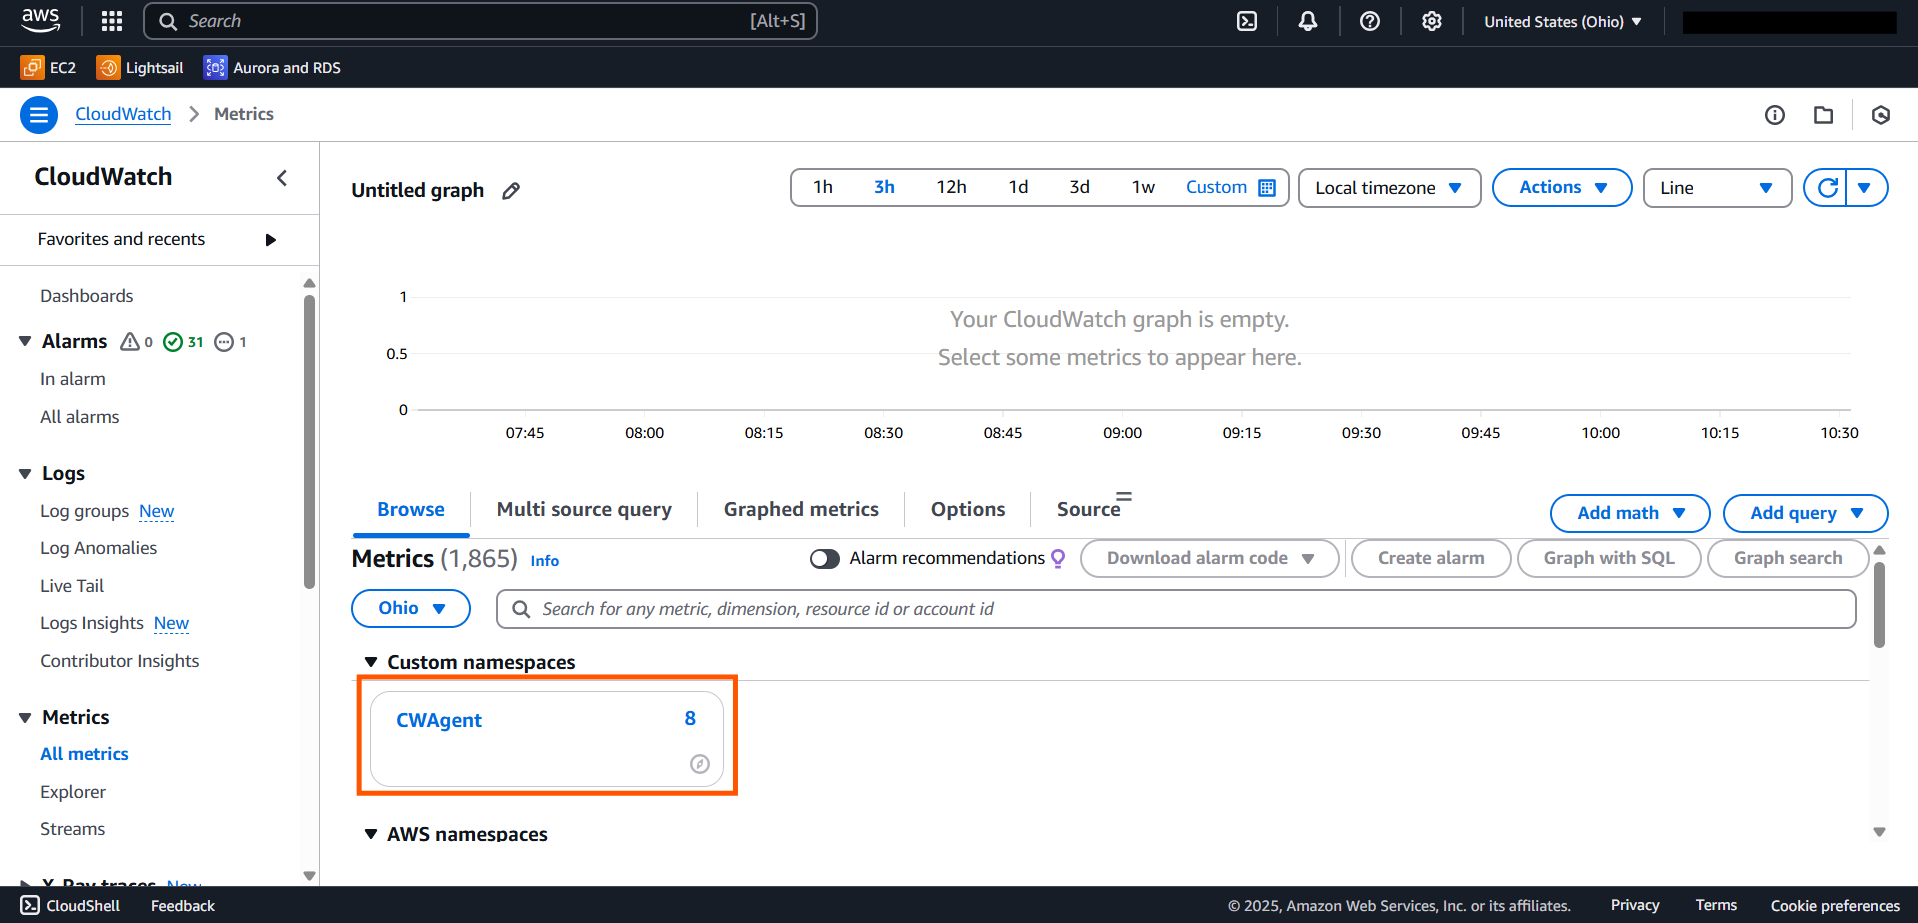
- Confirm if the custom metrics are being sent to CloudWatch.

- Now, let’s break down each metric in your configuration:
metrics_collection_interval: This is the frequency at which the metrics are collected. It’s set to 60 seconds, which means the CloudWatch agent will collect metrics every minute.run_as_user: This is the user that the CloudWatch agent runs as. It’s set to “root”, which means the agent has full permissions on the system.append_dimensions: These are the default dimensions that are assigned to all collected metrics. They include:ImageId: The ID of the Amazon Machine Image (AMI) used to launch the instance.InstanceId: The ID of the instance.InstanceType: The type of the instance.

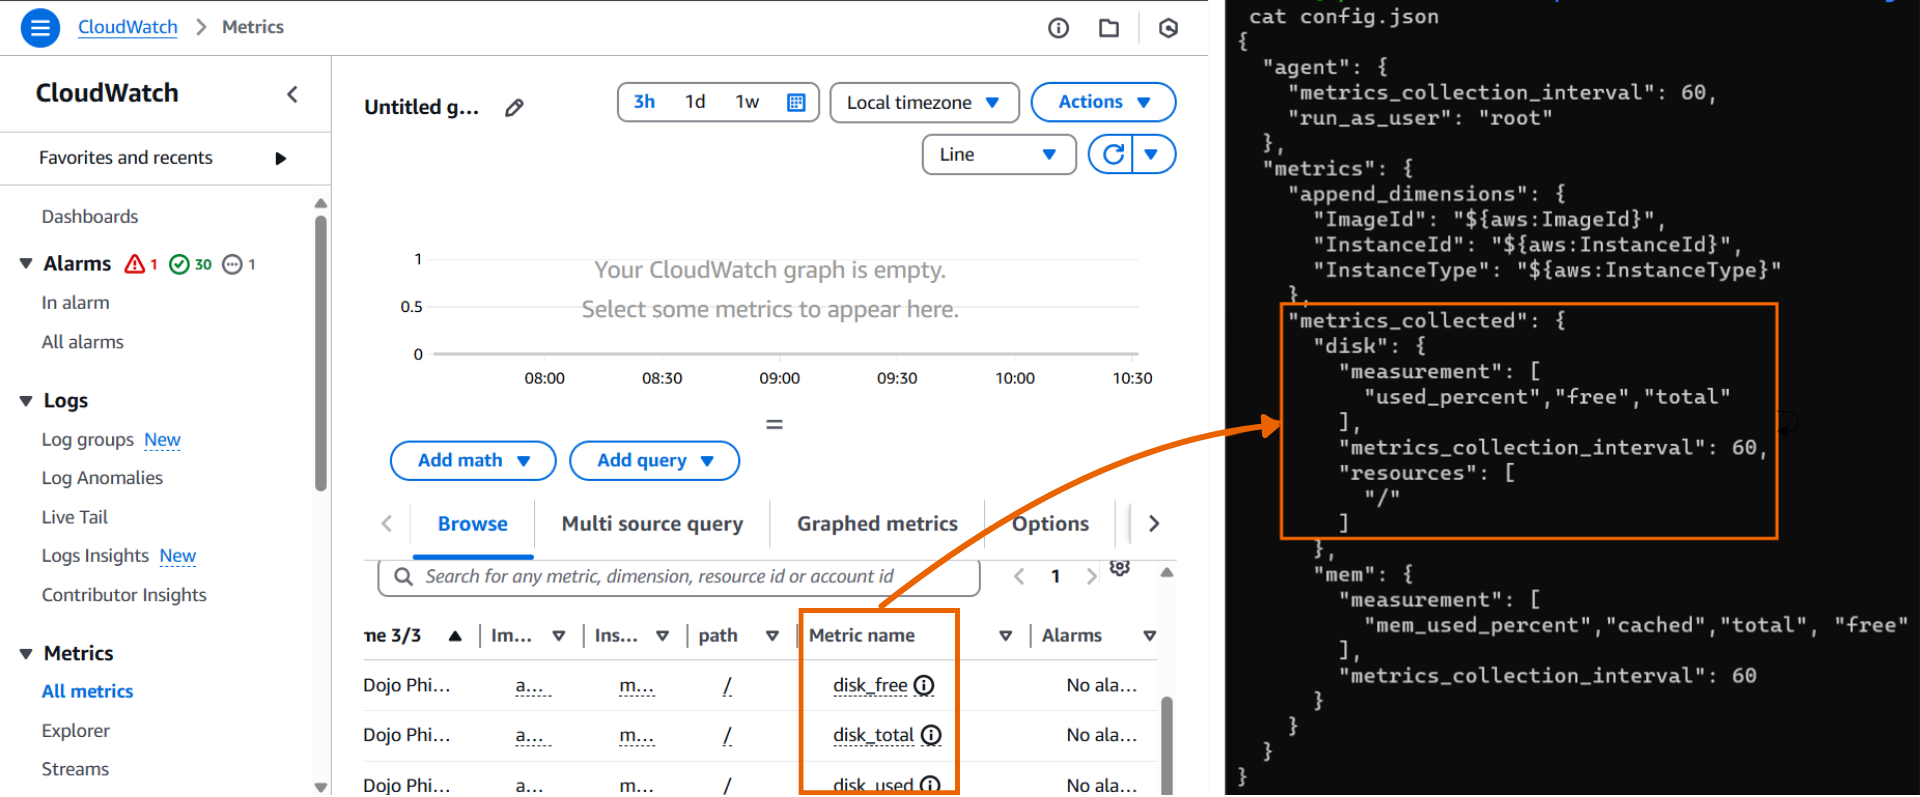
metrics_collected: This is where you specify the metrics that you want to collect. You’re collecting disk and memory metrics:disk: This collects metrics about disk usage. The metrics include:used_percent: The percentage of disk space used.free: The amount of free disk space.total: The total amount of disk space.metrics_collection_interval: The frequency at which the disk metrics are collected. It’s set to 60 seconds.resources: The file paths that the disk metrics are collected from. It’s set to “/”, which represents the root directory.

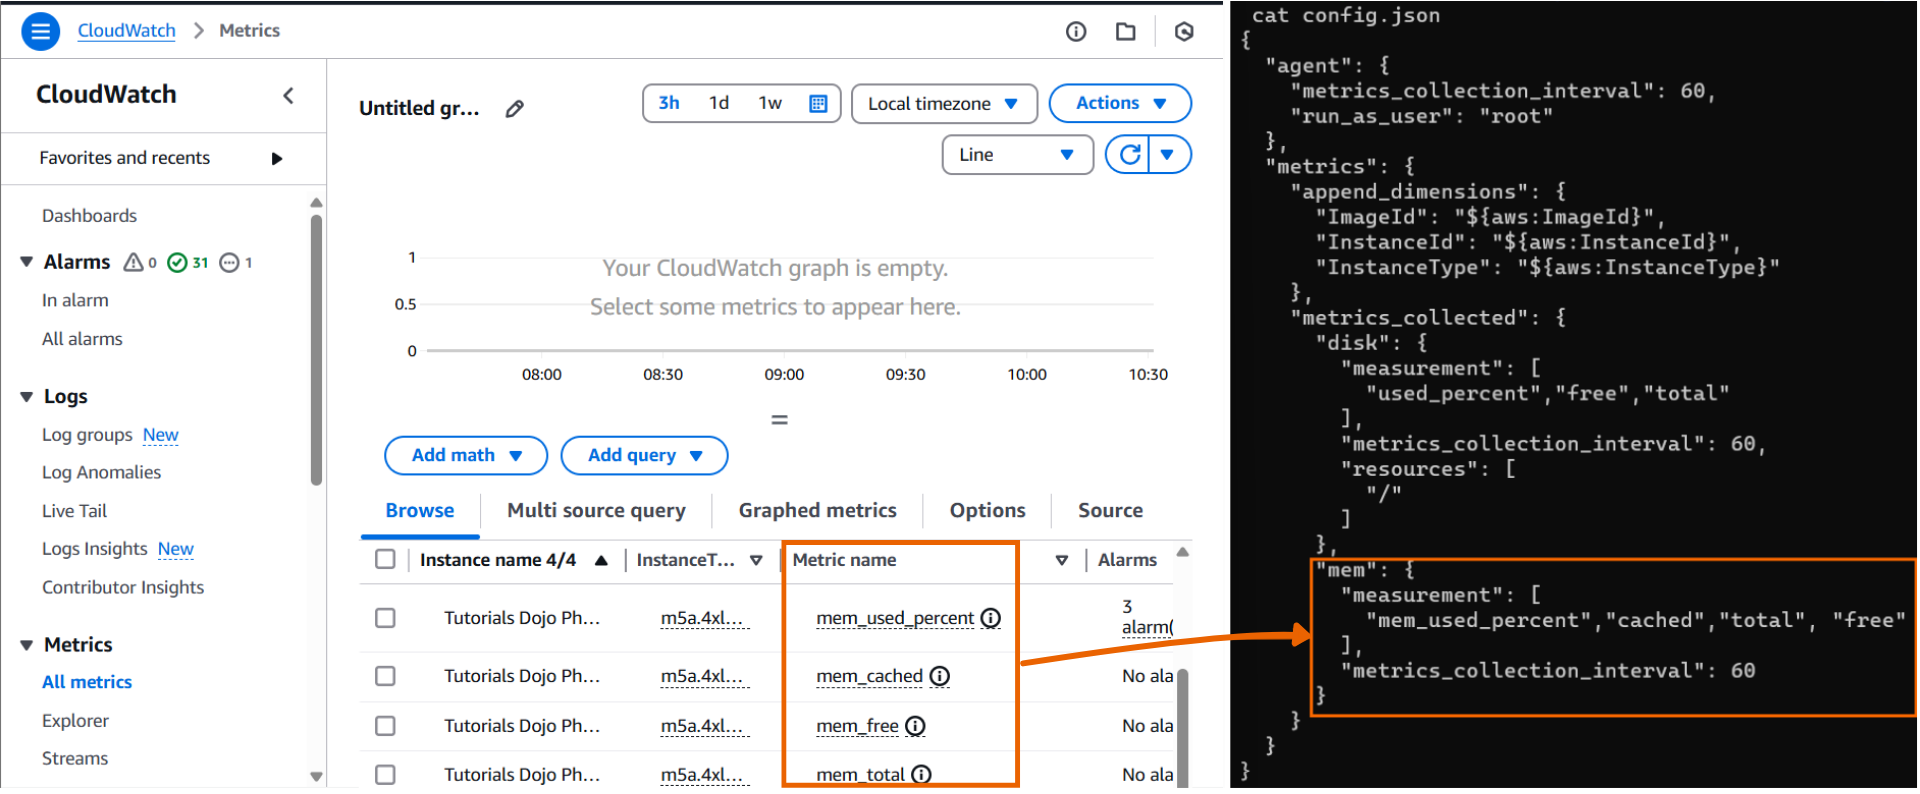
mem: This collects metrics about memory usage. The metrics include:mem_used_percent: The percentage of memory used.cached: The amount of cached memory.total: The total amount of memory.free: The amount of free memory.metrics_collection_interval: The frequency at which the memory metrics are collected. It’s set to 60 seconds.


Remember, you can customize this configuration to fit your specific needs by adding or removing metrics, changing the collection intervals, or modifying the dimensions.
Create Slack Notification for EBS Storage Disk Used
To send alerts to Slack when your EBS disk usage exceeds a threshold, you need to set up an SNS topic and AWS Lambda to forward these notifications to a Slack channel. Here’s how you can do it:
Step 1: Set Up AWS Lambda to Send Alerts to Slack
-
Create an AWS Lambda Function:
- Navigate to the Lambda service in the AWS Management Console.
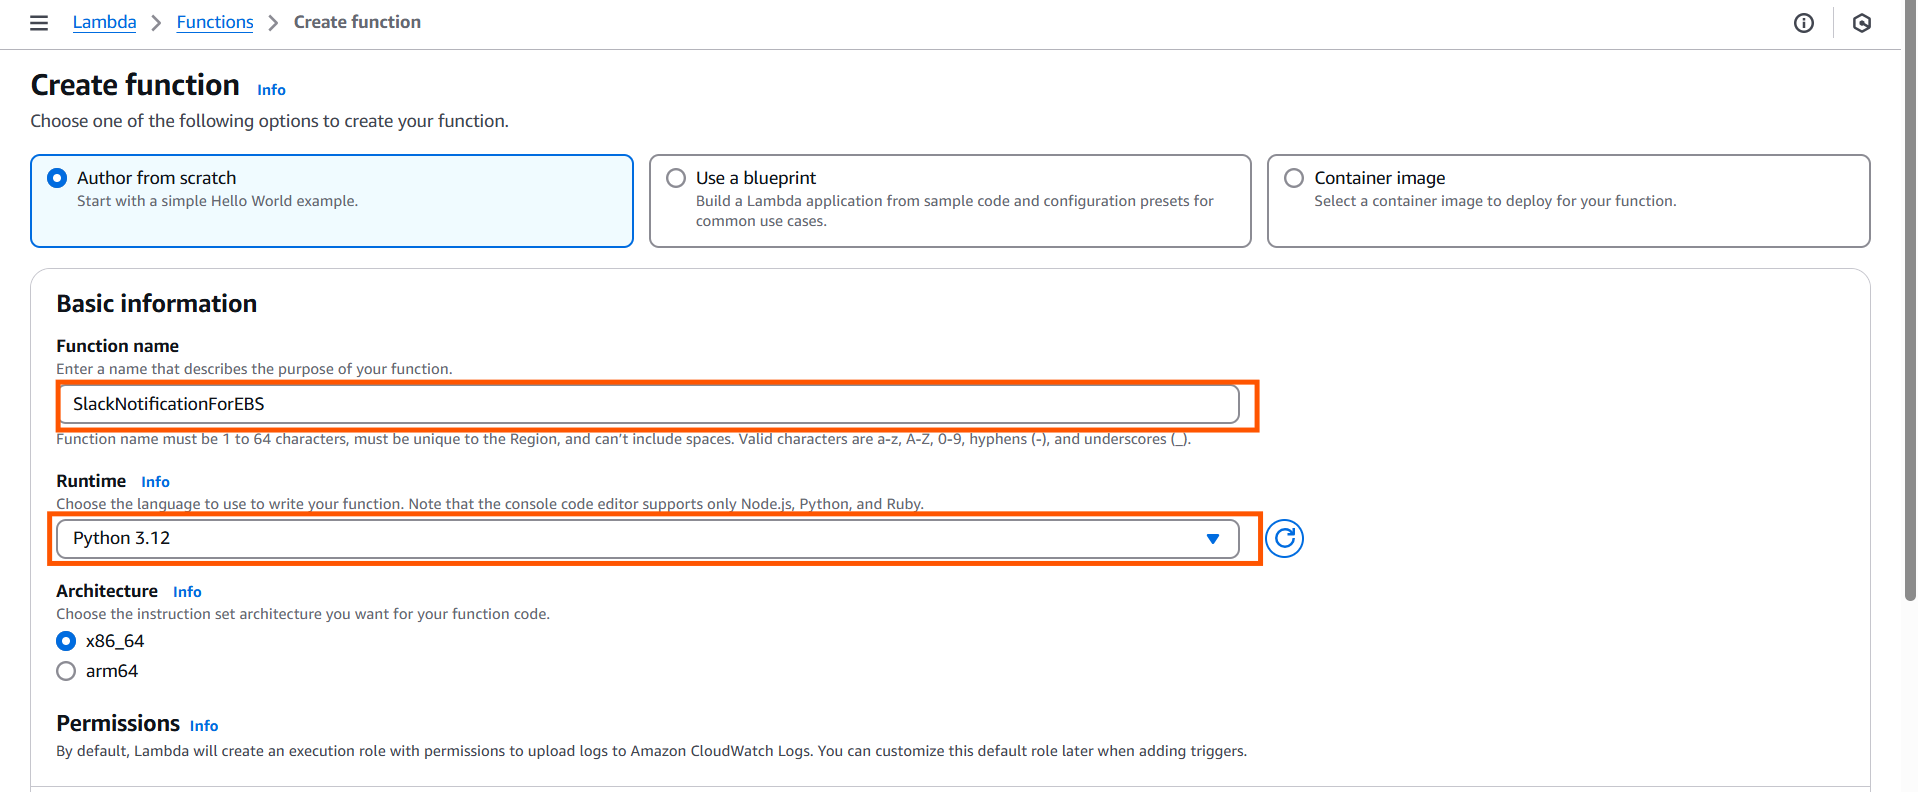
- Click Create function and select Author from scratch.
- Name your function (e.g., “SlackNotificationForEBS”).
- Choose a runtime like Python 3.12.

- In the Function code section, paste the following code to send messages to Slack:
import json
import urllib3

def lambda_handler(event, context):
    # Slack Webhook URL
    url = "https://hooks.slack.com/services/YOUR/SLACK/WEBHOOK"

    # Create a message based on the CloudWatch Alarm Event
    message = {
        "text": f"Alert: EBS Disk Usage exceeds threshold. \n{json.dumps(event)}"
    }

    # Send the message to Slack
    http = urllib3.PoolManager()
    response = http.request('POST', url, body=json.dumps(message), headers={'Content-Type': 'application/json'})

    return {
        'statusCode': 200,
        'body': json.dumps('Message sent to Slack')
    }
-
Replace
"https://hooks.slack.com/services/YOUR/SLACK/WEBHOOK"with your actual Slack incoming webhook URL. You can generate this URL by creating an incoming webhook in your Slack workspace. -
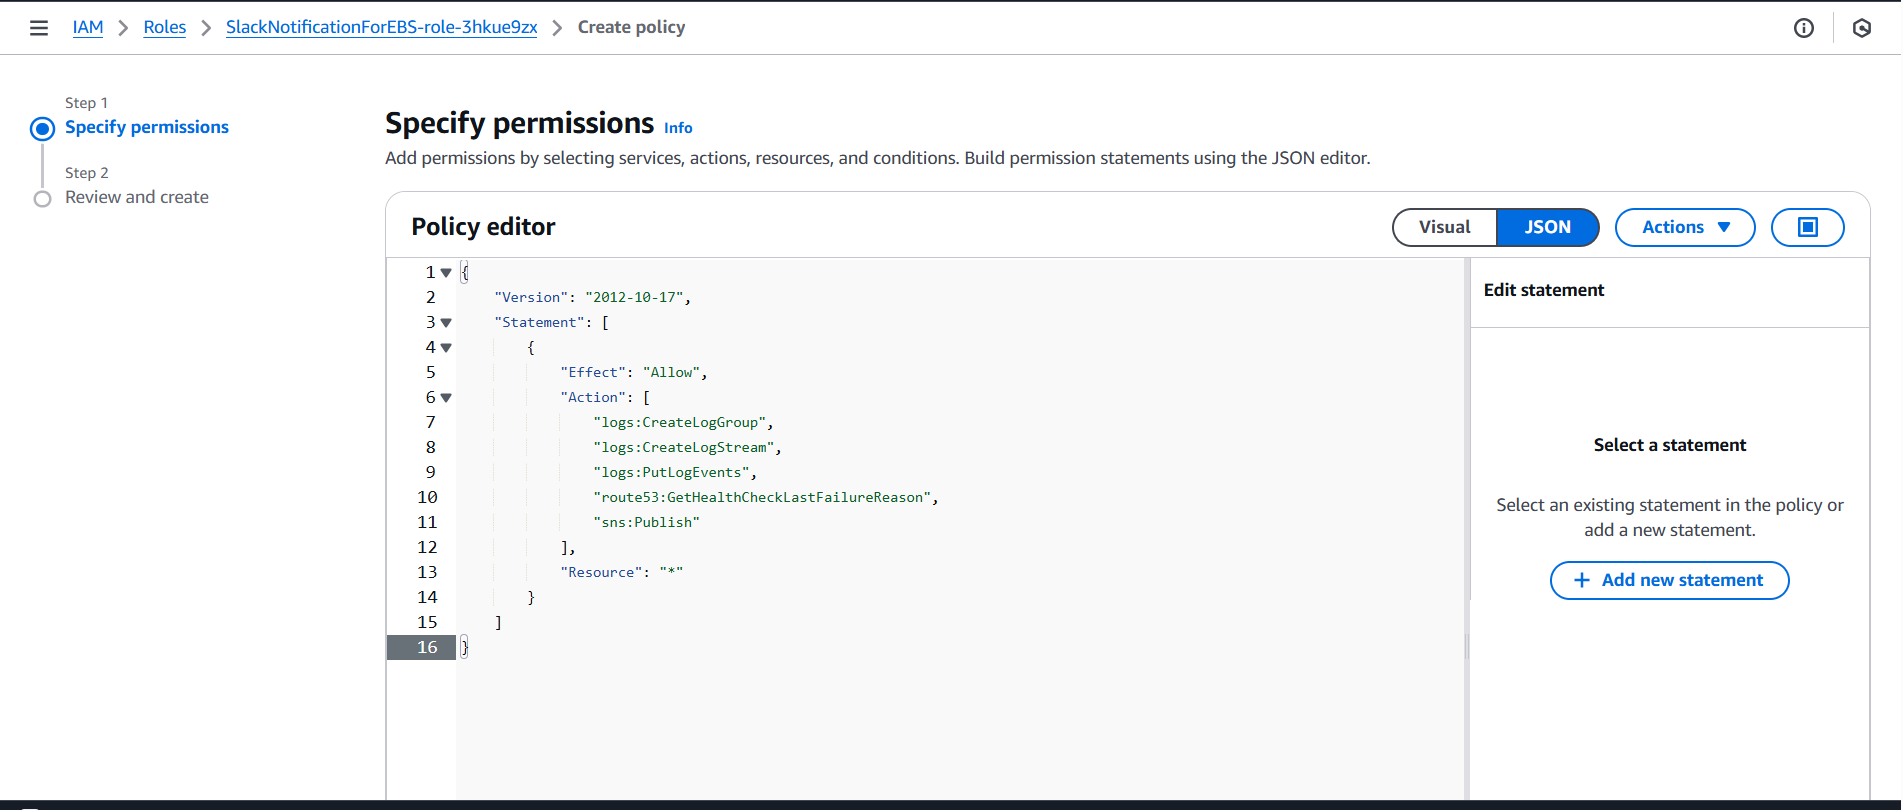
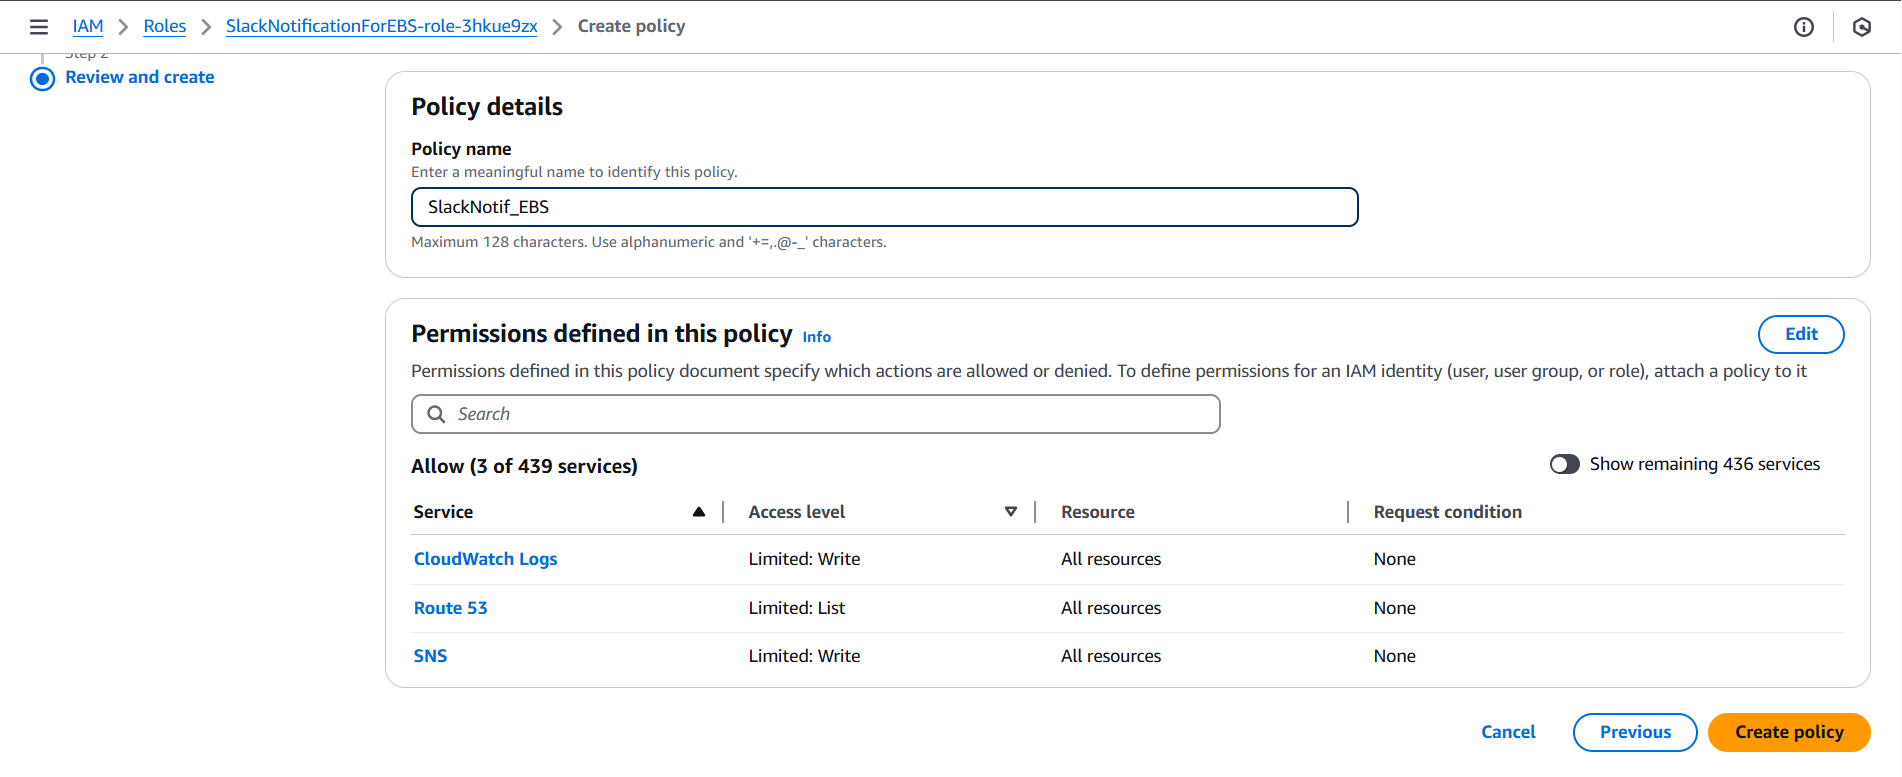
Create an Execution Role:
- In the Permissions section, create a new role with the necessary permissions to allow Lambda to publish to SNS.
{
    "Version": "2012-10-17",
    "Statement": [
        {
            "Effect": "Allow",
            "Action": [
                "logs:CreateLogGroup",
                "logs:CreateLogStream",
                "logs:PutLogEvents",
                "route53:GetHealthCheckLastFailureReason",
                "sns:Publish"
            ],
            "Resource": "*"
        }
    ]
}
- Click Next, review the permissions, and click Create Policy to proceed.

- In the Permissions section, create a new role with the necessary permissions to allow Lambda to publish to SNS.
Step 2: Create an SNS Topic
-
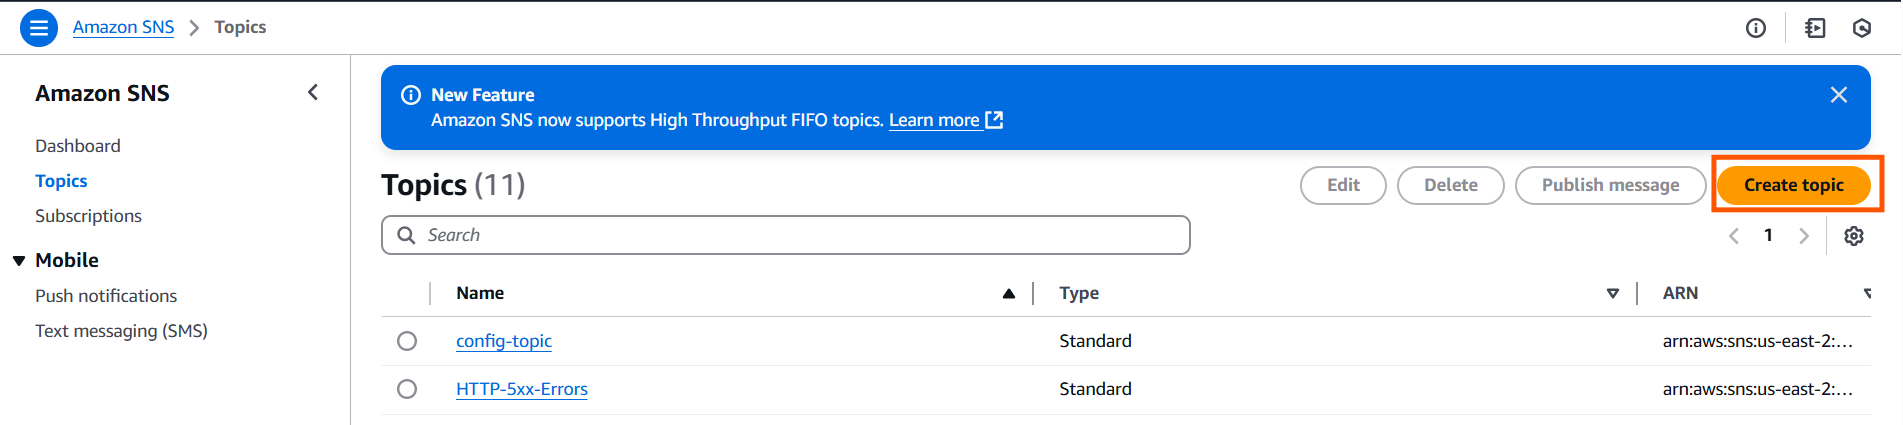
Open the AWS Management Console, navigate to the SNS (Simple Notification Service) dashboard. Click on Create topic.

-
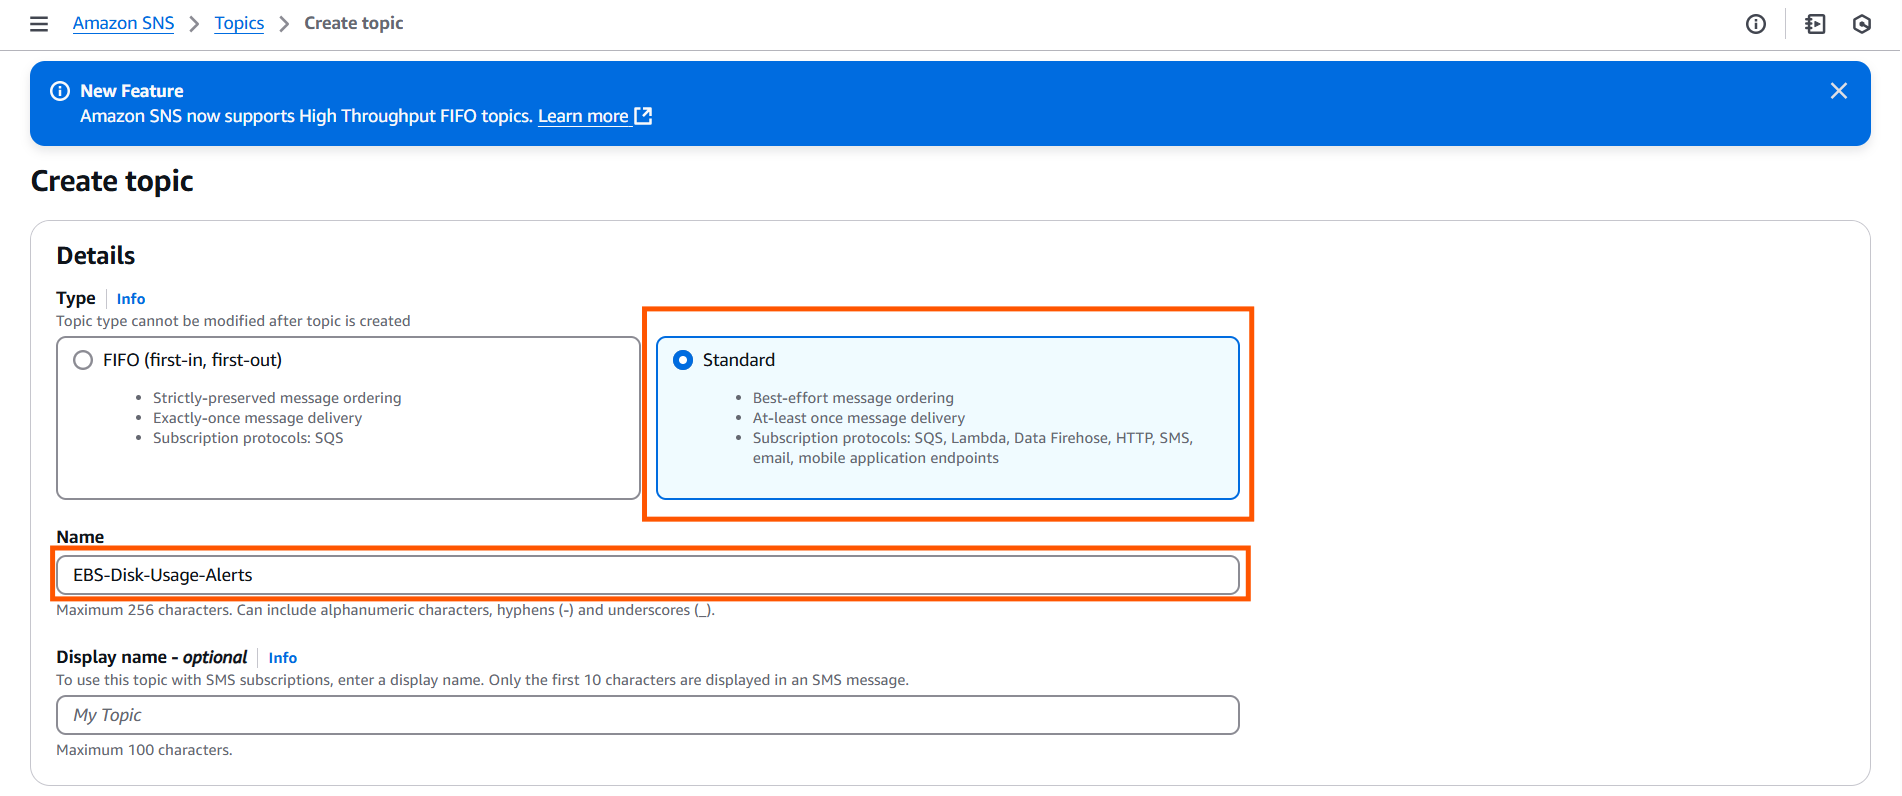
Configure the Topic:
- For Type, select Standard.
- Name the topic (e.g., “EBS-Disk-Usage-Alerts”).
- Click on Create topic.

-
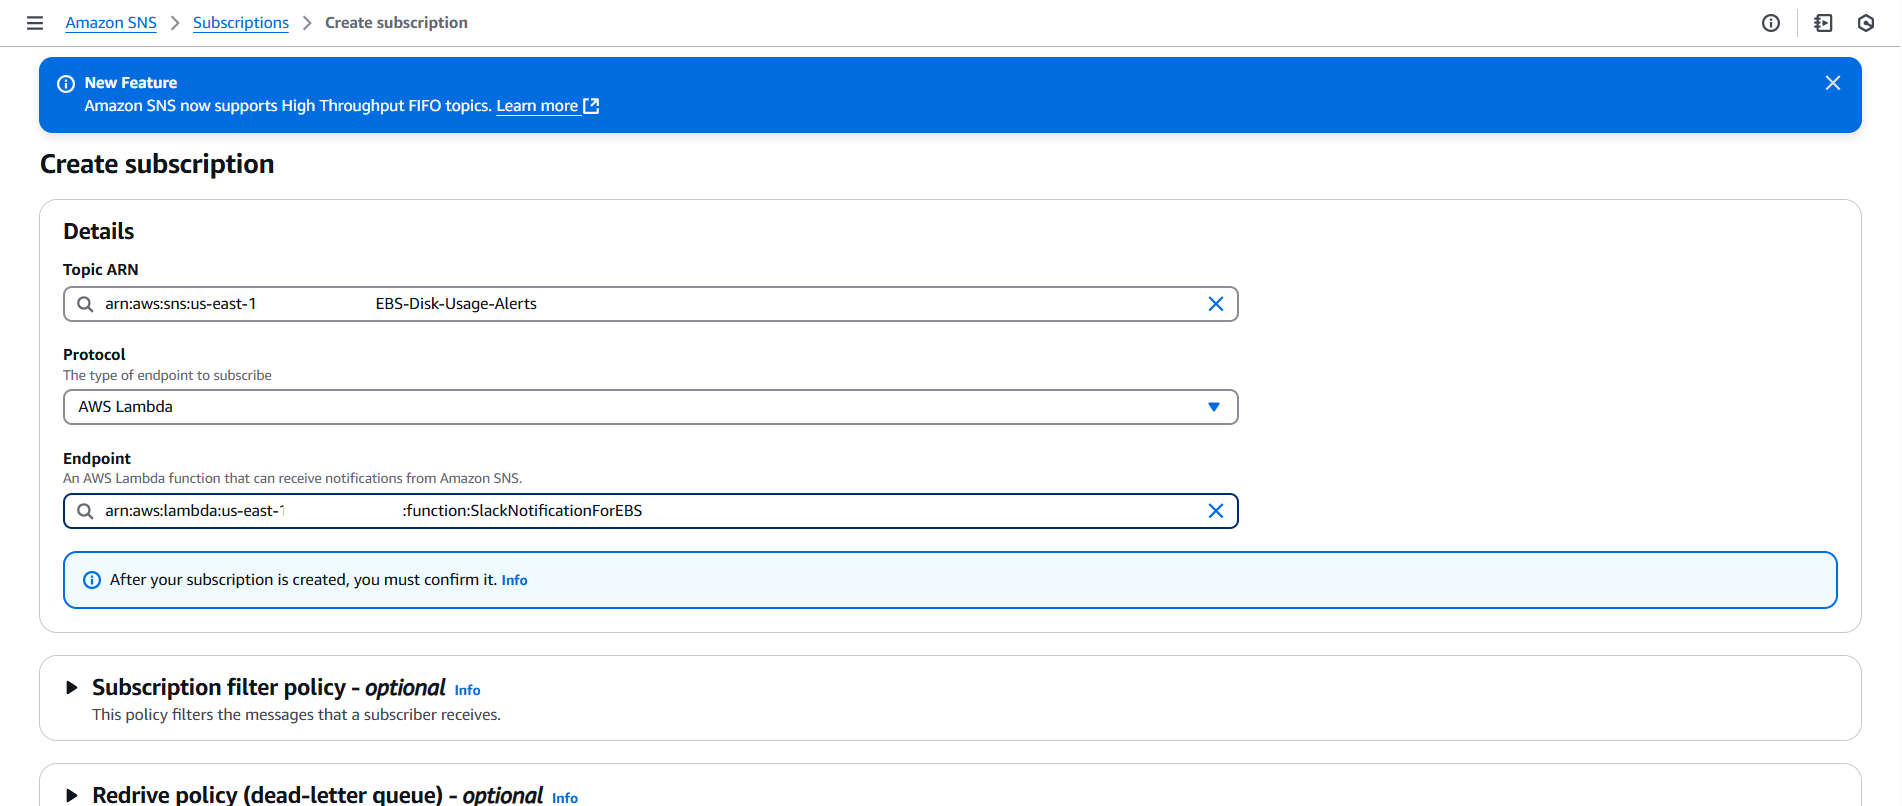
Create a Subscription:
- Once the topic is created, click on it and then click Create subscription.
- For Protocol, choose AWS Lambda.
- For Endpoint, you will enter the ARN of the Lambda function (to be created in the next steps).
- Leave other settings as default and click Create subscription.

Setting up EBS Storage Monitoring with CloudWatch
Amazon CloudWatch is a powerful tool that allows you to monitor your AWS resources, including EC2 instances and EBS volumes. To automate disk space monitoring, CloudWatch can track the “disk_used” metric, which shows the percentage of storage space used on your EBS volumes.
-
Log in to the AWS Management Console and navigate to CloudWatch.

-
Create an Alarm for EBS Disk Usage:
- In the CloudWatch console, click on Alarms in the left-hand menu, then click on Create Alarm.
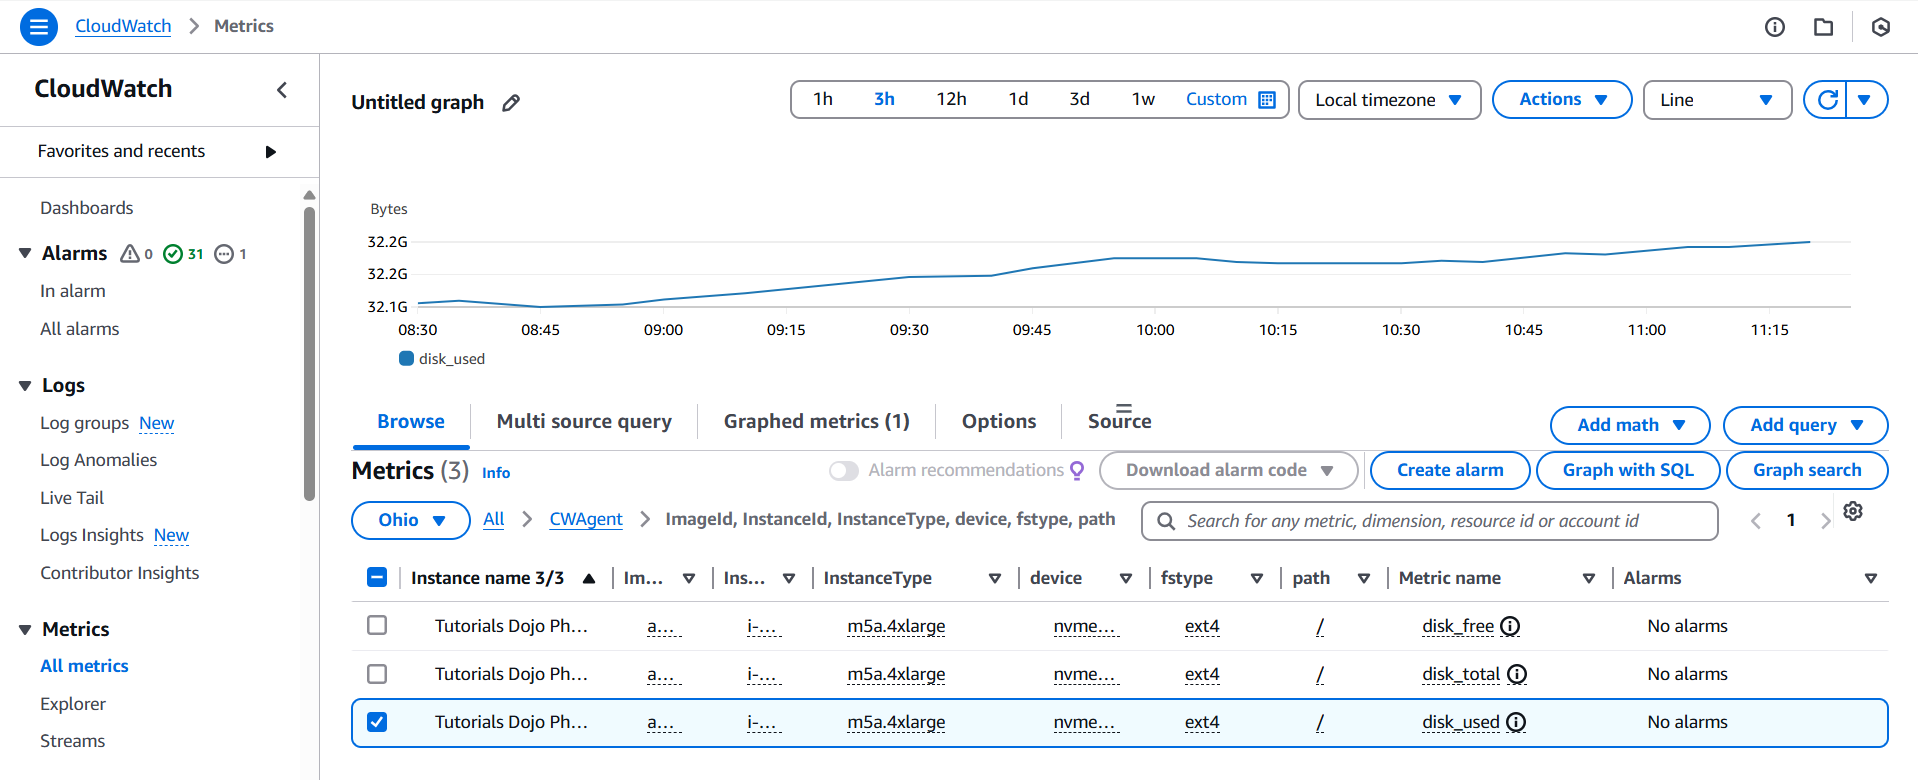
- Choose the CWAgent metric. This will show metrics like
disk_free,disk_used, anddisk_total. - Set the threshold for the
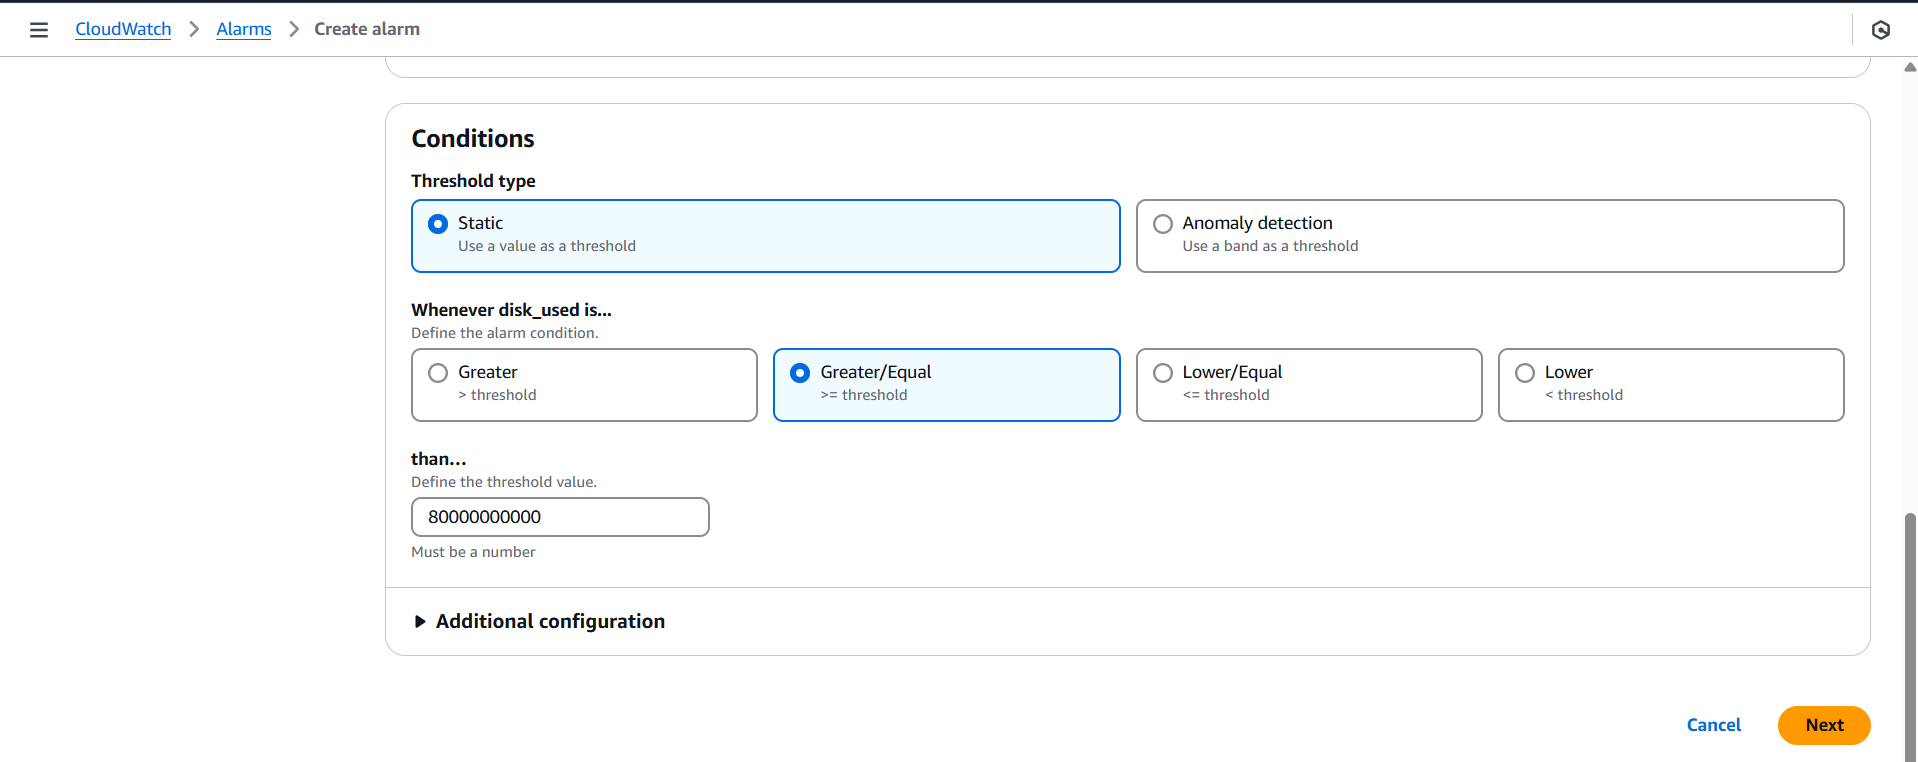
disk_usedmetric based on your preferred value. For example, you can set an alarm to trigger if disk usage exceeds 80% for 5 consecutive minutes.- Configure the metric, scroll down, and go to the Conditions table. Set the threshold type to Static, condition alarm to Greater/Equal, and the threshold value to 80000000000 (80%), then click next.

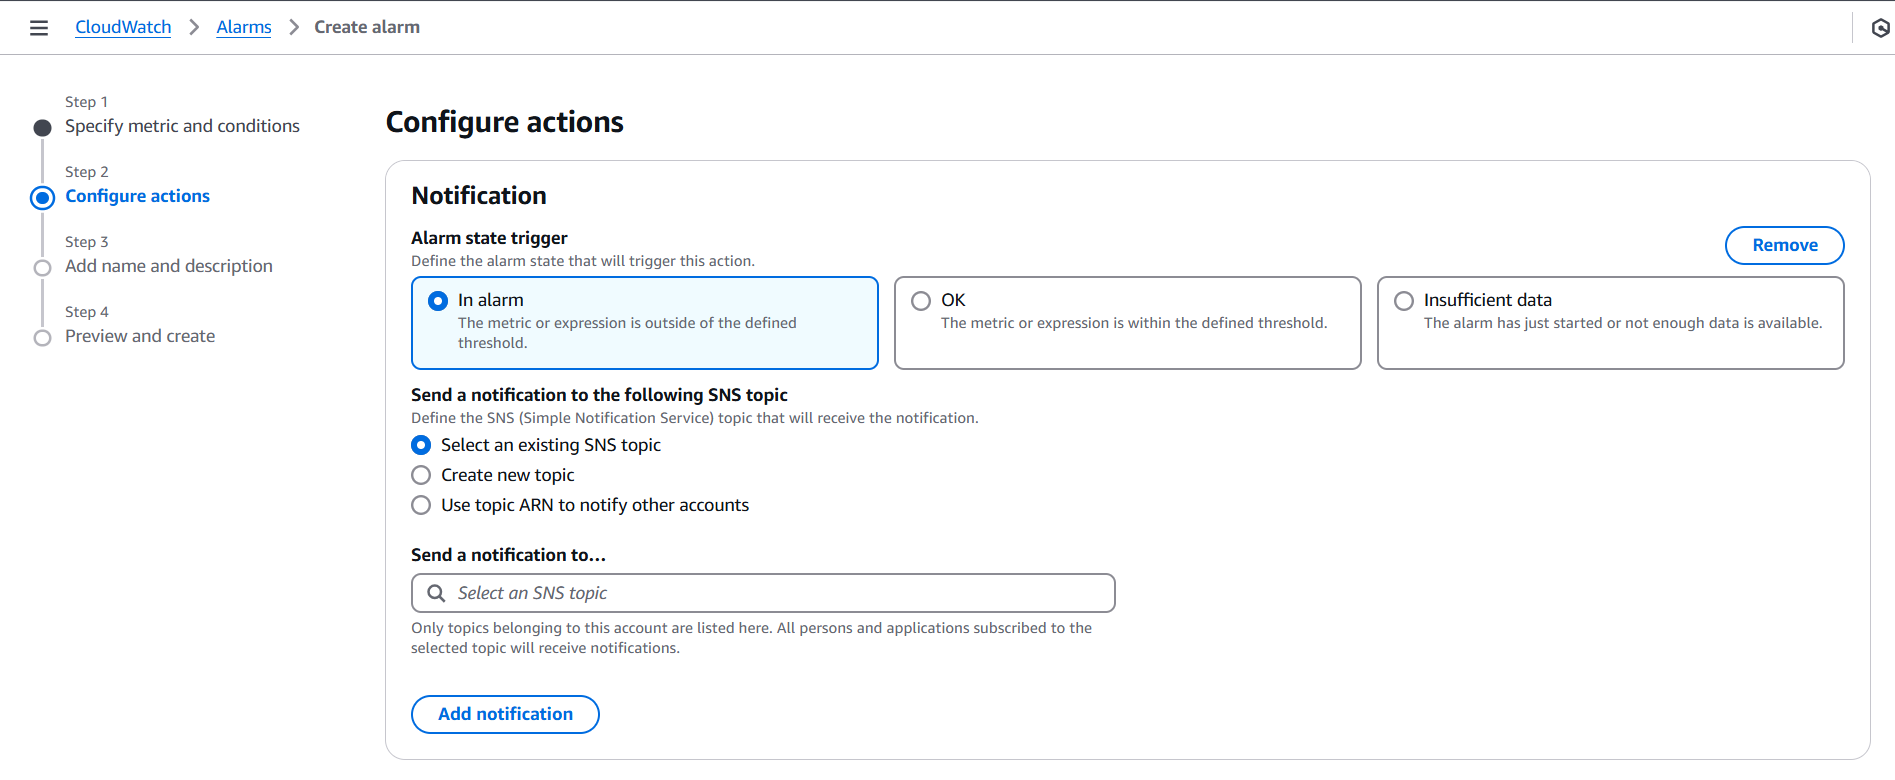
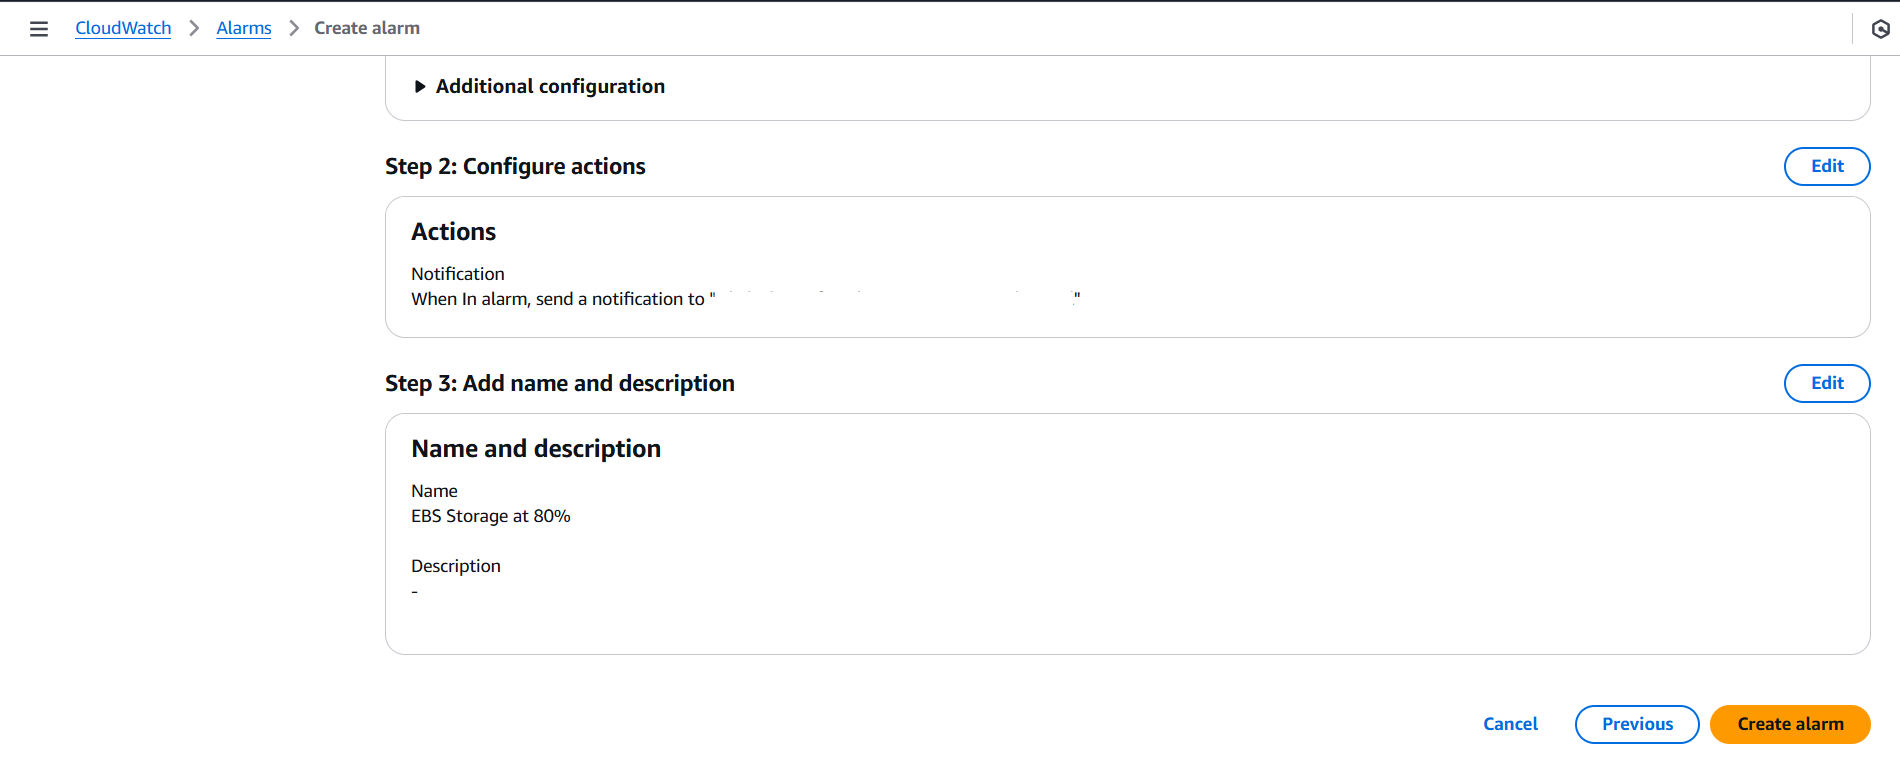
- Configure alarm actions. In send a notification to… select the SNS topic you have created, then click Next.

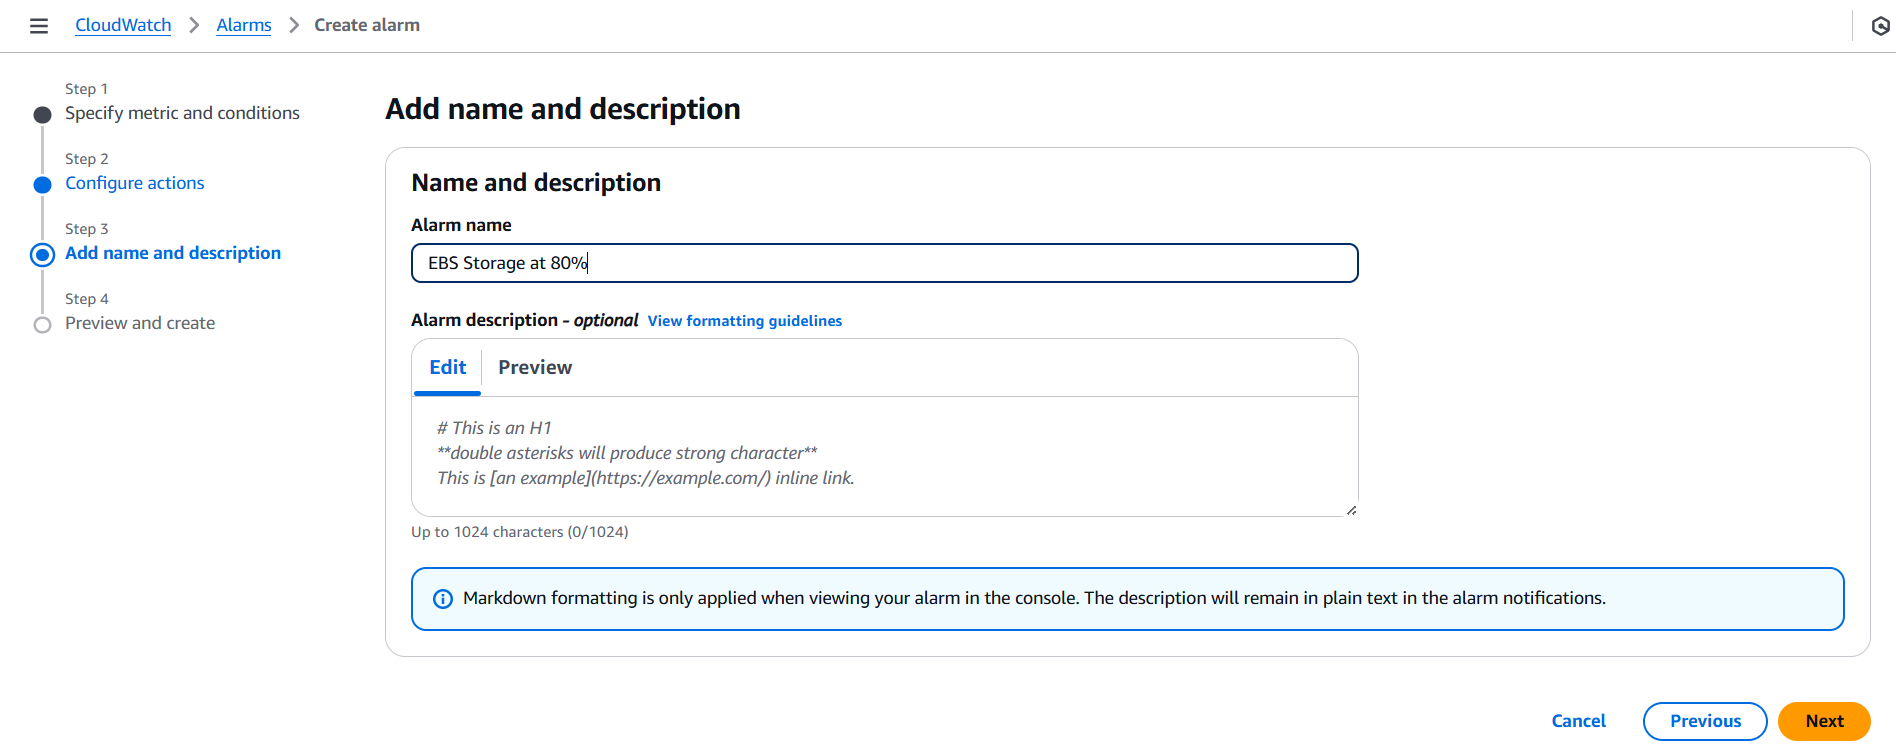
- Set the alarm name.

- Review the alarm configurations; click the Create alarm button if all are good.

- Repeat the steps above if you want to create another alarm.
- Configure the metric, scroll down, and go to the Conditions table. Set the threshold type to Static, condition alarm to Greater/Equal, and the threshold value to 80000000000 (80%), then click next.
That’s it! With the steps outlined above, you should now have automated monitoring in place for both EBS storage and memory usage.

Conclusion
By integrating Amazon CloudWatch with Slack, you can automate monitoring both EBS storage and memory utilization on your EC2 instances. This setup helps ensure that you are always aware of potential resource limitations before they become critical issues. With automated alerts sent directly to Slack, you can take immediate action to optimize your infrastructure and avoid costly downtimes.
🌸 25% OFF All Reviewers on our International Women’s Month Sale! Save 10% OFF All Subscriptions Plans & 5% OFF Store Credits/Gift Cards!

Learn AWS with our PlayCloud Hands-On Labs

$2.99 AWS and Azure Exam Study Guide eBooks

New AWS Generative AI Developer Professional Course AIP-C01

Learn GCP By Doing! Try Our GCP PlayCloud

Learn Azure with our Azure PlayCloud

FREE AI and AWS Digital Courses

FREE AWS, Azure, GCP Practice Test Samplers


Subscribe to our YouTube Channel

Follow Us On Linkedin