In digital marketing, every spent on advertising should contribute to measurable growth. But how do you determine if your Google Ads investment is truly delivering results? Businesses can assess the direct relationship between ad spend and conversions by analyzing key data from Google Ads and Google Analytics. This blog will explore how to justify an increase in Google Ads expenditure by reviewing sales performance and helping you make data-driven decisions to optimize your advertising budget and maximize ROI.
How to Analyze Google Ads and Google Analytics Data
To effectively measure the success of your advertising efforts, it’s essential to understand how Google Ads and Google Analytics work together.
Google Ads is an online advertising platform that allows businesses to create and display ads across Google’s search engine results pages (SERPs) and its advertising network. Using a pay-per-click (PPC) model, advertisers only pay when users click on their ads. Businesses can target their audience based on keywords, demographics, interests, and location, ensuring their ads reach the right people at the right time. Google Ads supports various ad formats, including text, display, video, and shopping ads, enabling businesses to promote their products and services across multiple platforms.
Google Analytics is a powerful web analytics tool that provides insights into website traffic and user behavior. It helps businesses track key performance indicators (KPIs) such as session duration, bounce rates, and conversion rates, allowing them to assess visitor engagement and identify areas for improvement.
Why Integrate Google Ads with Google Analytics?
By linking Google Ads with Google Analytics, businesses can comprehensively view of their advertising performance. This integration allows for:
- Tracking conversions to see which ads drive the most sales.
- Analyzing user behavior after they click on an ad, including time spent on site and interactions.
- Optimizing ad strategies based on actual user engagement data.
With this combined data, businesses can make informed decisions to refine their Google Ads campaigns, ensuring they maximize their return on investment (ROI) and reach their marketing goals.
You need clear insights into how your ads contribute to conversions and revenue to justify an increase in Google Ads spending. By reviewing key metrics in Google Ads and Google Analytics, you can measure ad performance, identify trends, and make data-driven decisions. Here’s a step-by-step guide:
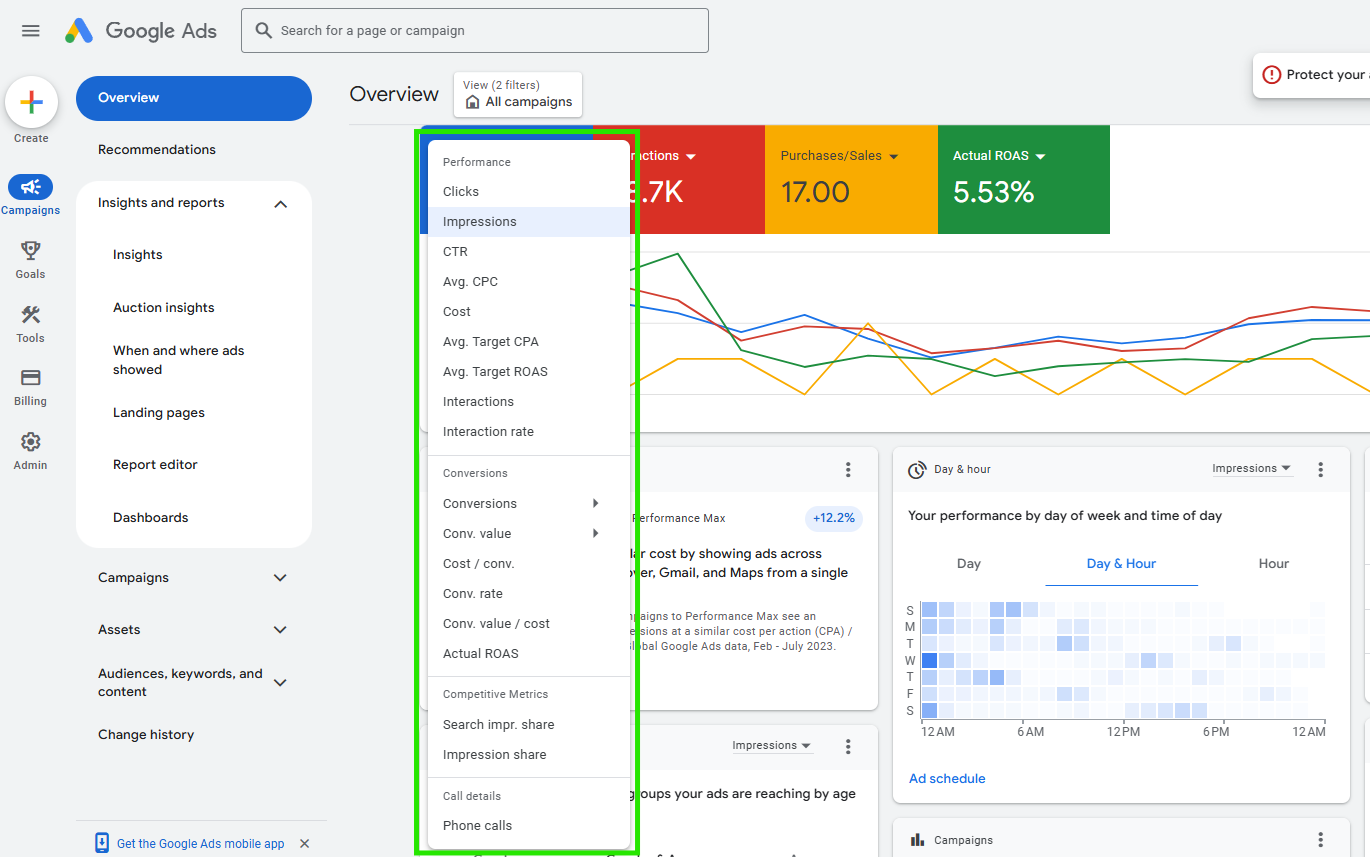
1. Identify Key Performance Metrics
Start by focusing on the essential data points that determine whether your Google Ads budget is generating results:
- Clicks & Impressions – Measure how many people see and interact with your ads.
- Click-Through Rate (CTR) – A high CTR indicates that your ad is relevant to users.
- Conversion Rate (CVR) – Tracks the percentage of users who take a desired action (purchase, signup, etc.).
- Cost Per Acquisition (CPA) – Determines how much you spend per conversion.
- Return on Ad Spend (ROAS) – Measures the revenue generated for every spent on ads.
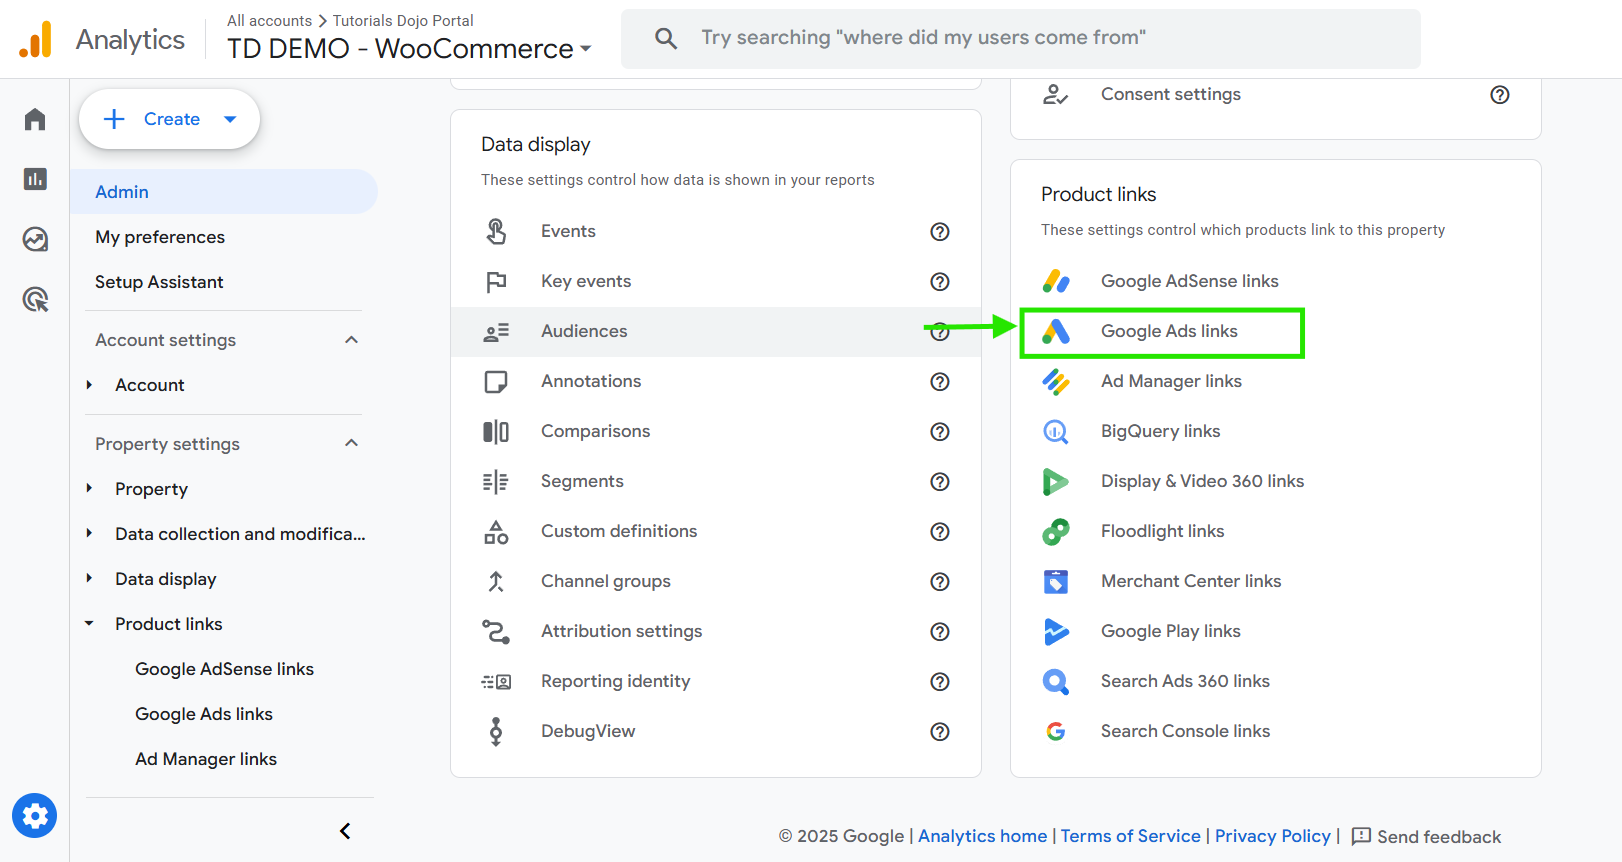
2. Link Google Ads with Google Analytics
To get a complete picture of customer behavior, integrate Google Ads with Google Analytics:
- Go to Google Analytics > Admin > Google Ads Links.

- Click “Link,” select your Google Ads account, and enable data sharing.
- Once linked, you can track user behavior after clicking an ad.

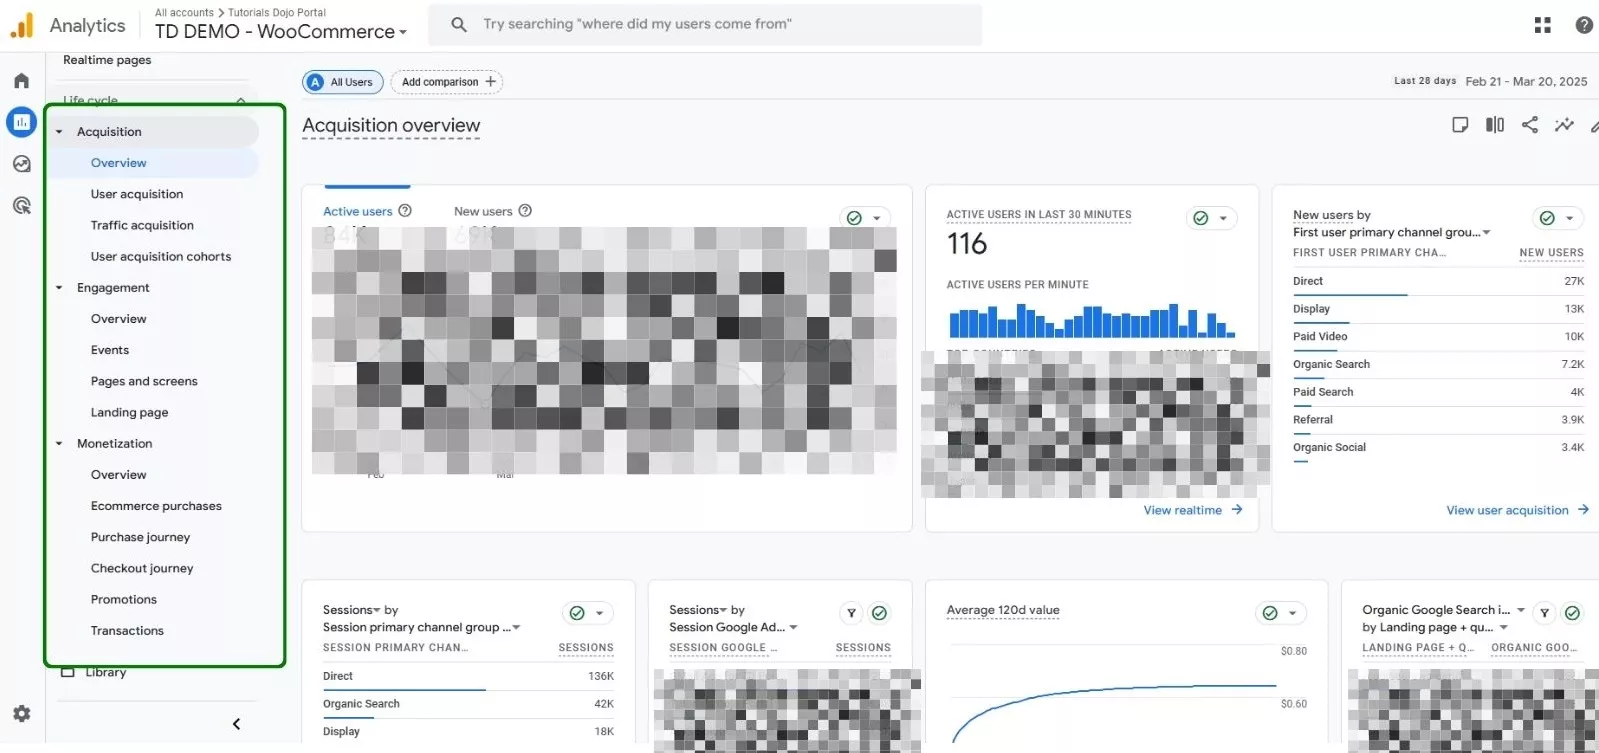
3. Track Conversions and Sales Performance
With the accounts linked, use Google Analytics Reports to analyze:
- Acquisition Report → See which campaigns drive the most traffic.
- User Acquisition → Understand how users navigate your website after clicking an ad.
- E-commerce Tracking → Track purchases, revenue, and average order value (AOV).

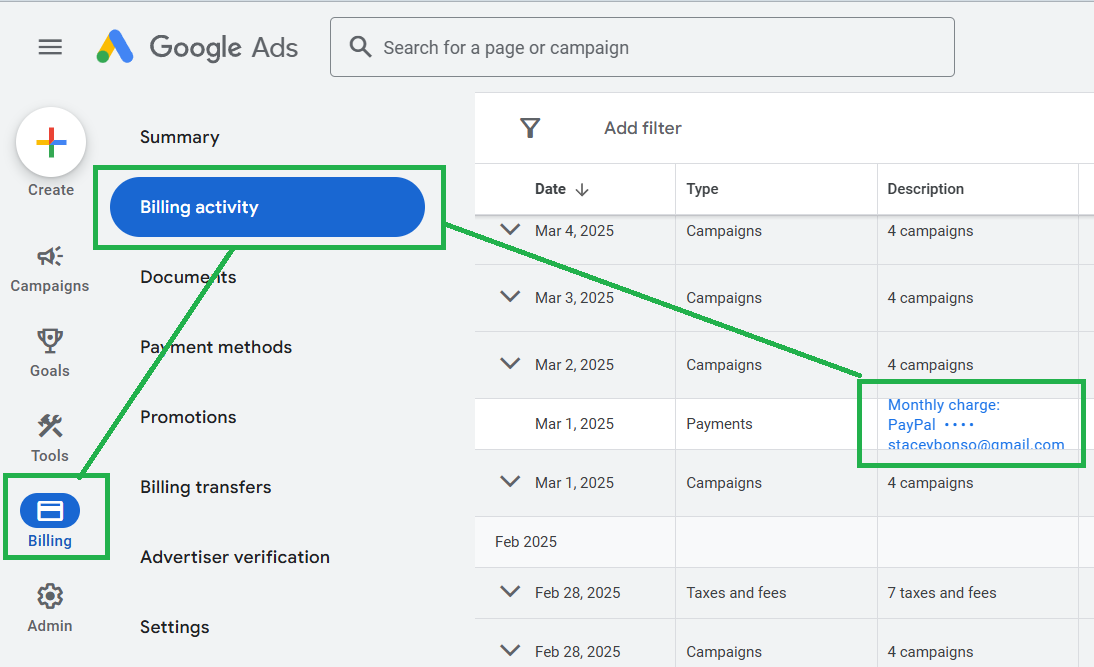
How to get your Monthly and threshold charge on Google Ads
Step 1: In your Google ads account, navigate to Billing > Billing Activity
Step 2: Under Description, check for the Monthly and Threshold charges. Click the blue font so you can download the receipt.
Note: You’ll be charged:
-
On the 1st of each month and – (MONTHLY CHARGE)

-
Any time your balance reaches your ₱30,000.00 threshold – (THRESHOLD CHARGE)

4. Compare Ad Spend vs. Revenue
To determine if increasing your Google Ads budget is justifiable:
- Calculate ROAS = (Revenue from Ads / Ad Spend) × 100
- Example: If you spend P30,000 on Google Ads and generate P90,000 in sales, your ROAS is 300%, meaning you earn P3 for every P1 spent.
5. Adjust Campaigns for Better Performance
If your ROAS is low, consider:
- Refining keyword targeting.
- Optimizing landing pages for conversions.
- Testing different ad creatives (A/B testing).
- Adjusting bid strategies for high-performing keywords.
By regularly reviewing these data points, you can confidently decide whether to increase or optimize your Google Ads budget for maximum profitability.
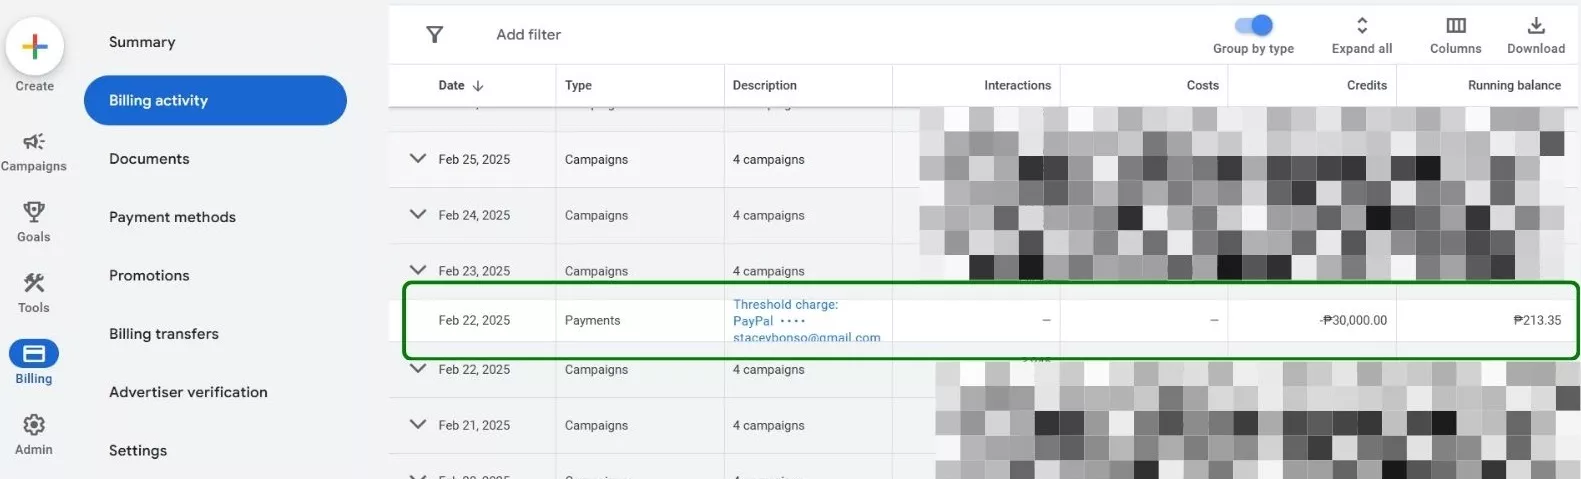
Monitor Your Total Revenue from Monthly and Threshold Billing Cycles
In this example, we’ll start by checking the coverage dates of the monthly and threshold billing cycles in Google Ads Billing activity.
Next, in Google Analytics, go to the Monetization section and click on E-commerce Purchases. Adjust the date range to match your billing cycle. For example, if your threshold charge covers February 2 – February 22, 2025, set the same date range in Google Analytics to track your total revenue during that period.
Once done, you can now check how much total revenue was generated within the billing cycle.

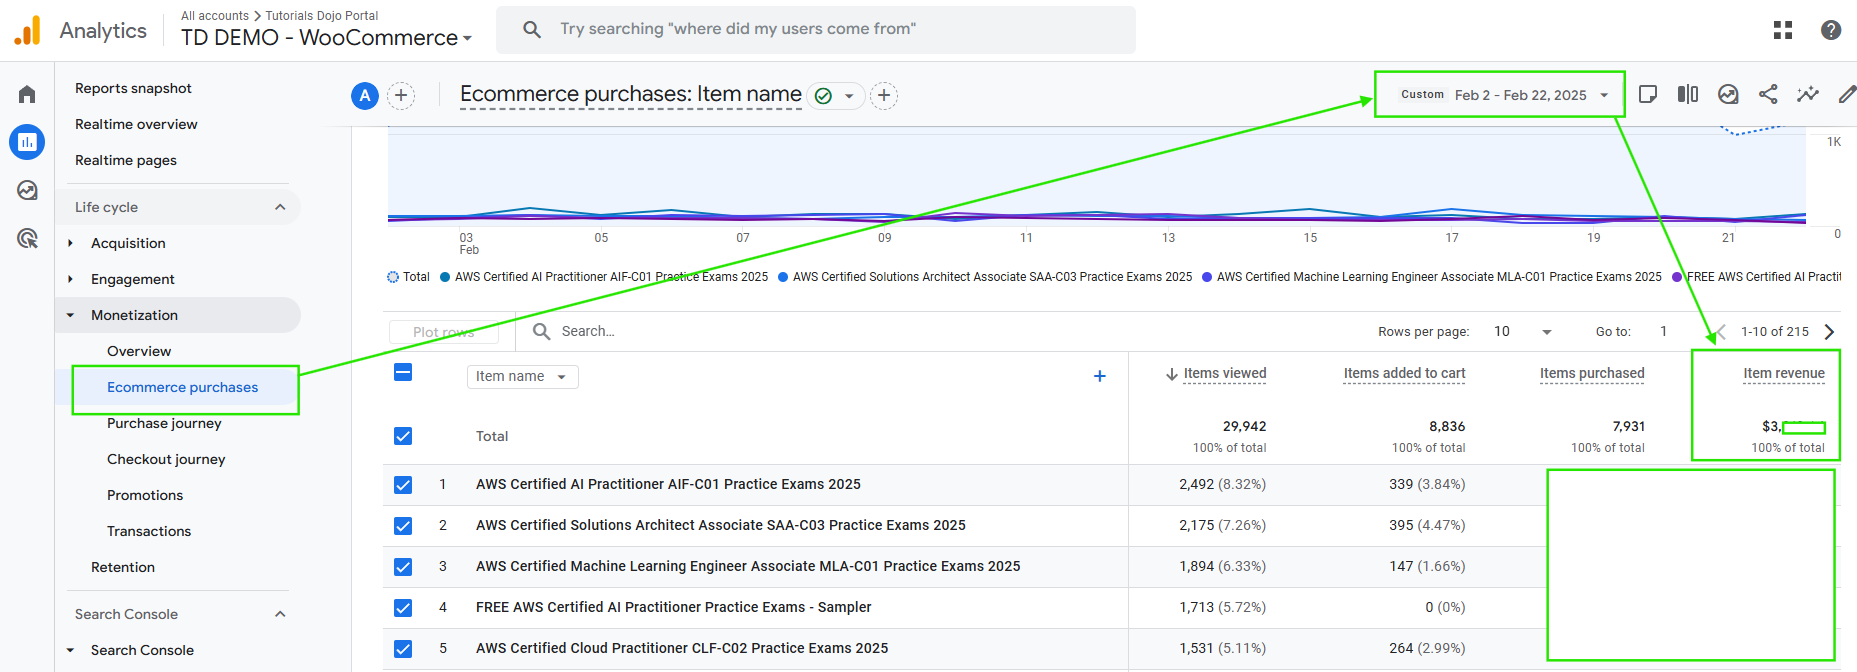 Note: The data, numbers, and metrics shown in the images are for illustration purposes only and do not represent actual figures. For accurate insights, please refer to your own Google Ads and Google Analytics reports.
Benefits of Analyzing Google Ads Spend vs. Sales Performance
Understanding the relationship between your Google Ads expenditure and the resulting sales is crucial for several reasons:
-
Optimized Budget Allocation: By identifying which campaigns yield the highest returns, you can allocate your budget more effectively, ensuring that funds are directed toward the most profitable initiatives.
-
Enhanced Ad Performance: Regular analysis allows you to refine ad copy, targeting, and bidding strategies, improving click-through and conversion rates.
-
Increased ROI: By focusing on high-performing keywords and ads, you can achieve a better return on investment, maximizing the effectiveness of your advertising spend.
-
Data-Driven Decision Making: Access to detailed performance metrics enables informed decisions, allowing for strategic adjustments that align with business objectives.
Key Takeaways
To leverage the benefits of analyzing your Google Ads spending versus sales performance, consider the following steps:
-
Set Clear Goals: Define specific campaign objectives, such as increasing website traffic, generating leads, or boosting sales. Clear goals provide direction and facilitate the measurement of success.
-
Regular Performance Reviews: Consistently monitor key metrics like conversions, cost per acquisition (CPA), and return on ad spend (ROAS) to identify trends and areas for improvement.
-
Optimize Campaign Settings: Adjust campaign parameters, including keyword selection, ad copy, and targeting options, to enhance performance and efficiency.
-
Utilize Ad Extensions: Implement ad extensions to provide additional information and improve ad visibility, which can lead to higher click-through rates.
-
Continuous Testing: Employ A/B testing for different ad elements to determine what resonates best with your audience, allowing for continuous improvement.
-
Leverage Analytical Tools: Use tools like Google Analytics to gain deeper insights into user behavior and campaign effectiveness, facilitating data-driven decisions.
By consistently analyzing Google Ads spending against sales performance, businesses can make informed decisions that drive growth and maximize return on investment (ROI). This approach ensures that every spent contributes to the company’s overall marketing objectives and business goals.
References:
https://support.google.com/google-ads/answer/6268637
https://support.google.com/google-ads/answer/6319
https://developers.google.com/analytics/devguides/collection/ga4
https://ads.google.com/intl/en_us/home/resources/articles/how-to-analyze-google-ads-successfully/
🌸 25% OFF All Reviewers on our International Women’s Month Sale! Save 10% OFF All Subscriptions Plans & 5% OFF Store Credits/Gift Cards!

Learn AWS with our PlayCloud Hands-On Labs

$2.99 AWS and Azure Exam Study Guide eBooks

New AWS Generative AI Developer Professional Course AIP-C01

Learn GCP By Doing! Try Our GCP PlayCloud

Learn Azure with our Azure PlayCloud

FREE AI and AWS Digital Courses

FREE AWS, Azure, GCP Practice Test Samplers


Subscribe to our YouTube Channel

Follow Us On Linkedin