The Amazon EC2 enables developers up to businesses to deploy their own applications with flexibility, high availability, and cost-efficiency as it removes the need to invest in physical hardwares or servers. From running applications, hosting websites, and managing databases, EC2 serves as the foundation for anything that is cloud-based. Talking about its cost-efficiency, there are different “Instance Purchasing Options” that you can choose from depending on your server requirements and also your financial capabilities. And these are: On-Demand Instances, Spot Instances, Reserved Instances, Dedicated Host, Savings Plans, and Capacity Reservation. As I would like to discuss the difference between those options, the main focus for this article is the Reserved Instance (RIs), and the comparison between two of its key metrics: RI Utilization vs RI Coverage.
Utilization vs Coverage
Before we delve into the specific meaning of these terms, let’s first understand what “Utilization” and “Coverage” mean. Utilization means “to make use of something in an effective way.” It actually shows how you “utilize” a certain product, meaning the gap between what it could achieve and what it is currently doing. Meanwhile, coverage tells us the area of inclusion that a product or system can provide. So how does that compare when we are now talking about it in terms of Amazon EC2 Reserved Instances? It is actually closely related to it.
RI Utilization vs RI Coverage
Reserved Instances are a type of Instance Purchasing Option that is cheaper than On-Demand instances but still allows for uninterruptible workloads in exchange for one or three years of usage. Basically, it provides you with lesser cost in exchange for a long-term commitment of using their capacity. This is because, in return, AWS can allocate their resources more efficiently and accordingly for their millions of users globally. To keep track of how you capitalize on your RIs, you can view your RI Utilization and RI Coverage. Stated below is a clear definition and differentiation between these two metrics.
- RI Utilization – it indicates how effectively you are using your RI resources, comparing your actual usage to the total hours that it is available for usage.
- RI Coverage – it displays how much of your resource usage are covered by RI compared to the total resource usage including the other instances (e.g. On-Demand).
Although the terms sound similar, it can be easily understood what is the difference between the two. RI Utilization focuses solely on how effectively you are using your RIs while RI Coverage compares your RI to all of your instances’ total usage. And both of these are tightly coupled on your Amazon EC2 Instance type. AWS actually tracks and informs you about these through providing RI Utilization and RI Coverage reports viewable in AWS Billing and Cost Management.
The AWS Billing and Cost Management
The AWS Billing and Cost Management is a cost and billing tool by AWS that helps users monitor their expenditures in the AWS cloud. It provides statistical data and visualization interface that display your usage pattern and helps you decide on how you can further optimize both your cost and resource management. The Reserved Instances has its own tool here where you can view its Utilization and Coverage. Just navigate to the AWS Billing and Cost Management and on the lefthand side near the bottom, you can see the “Reservations”. And then from here you can now view either the “Utilization Report” or “Coverage Report”.
RI Utilization Report – AWS Billing and Cost Management

Shown above is an example of the RI Utilization Report interface. As you can see, it displays the cost of utilizing your Reserved Instance, its On-Demand cost equivalent, and the total net savings of using RI over On-Demand (colored green). It also shows the maximum potential savings of using RI over On-Demand. The graph below shows the actual RI Utilization Report graph which you can adjust to display your desired period (data range), linked account, region, instance type, and other filters located on the righthand side. And on the graph itself you can see if you are fully utilizing your Reserved Instances.

RI Coverage Report – AWS Billing and Cost Management
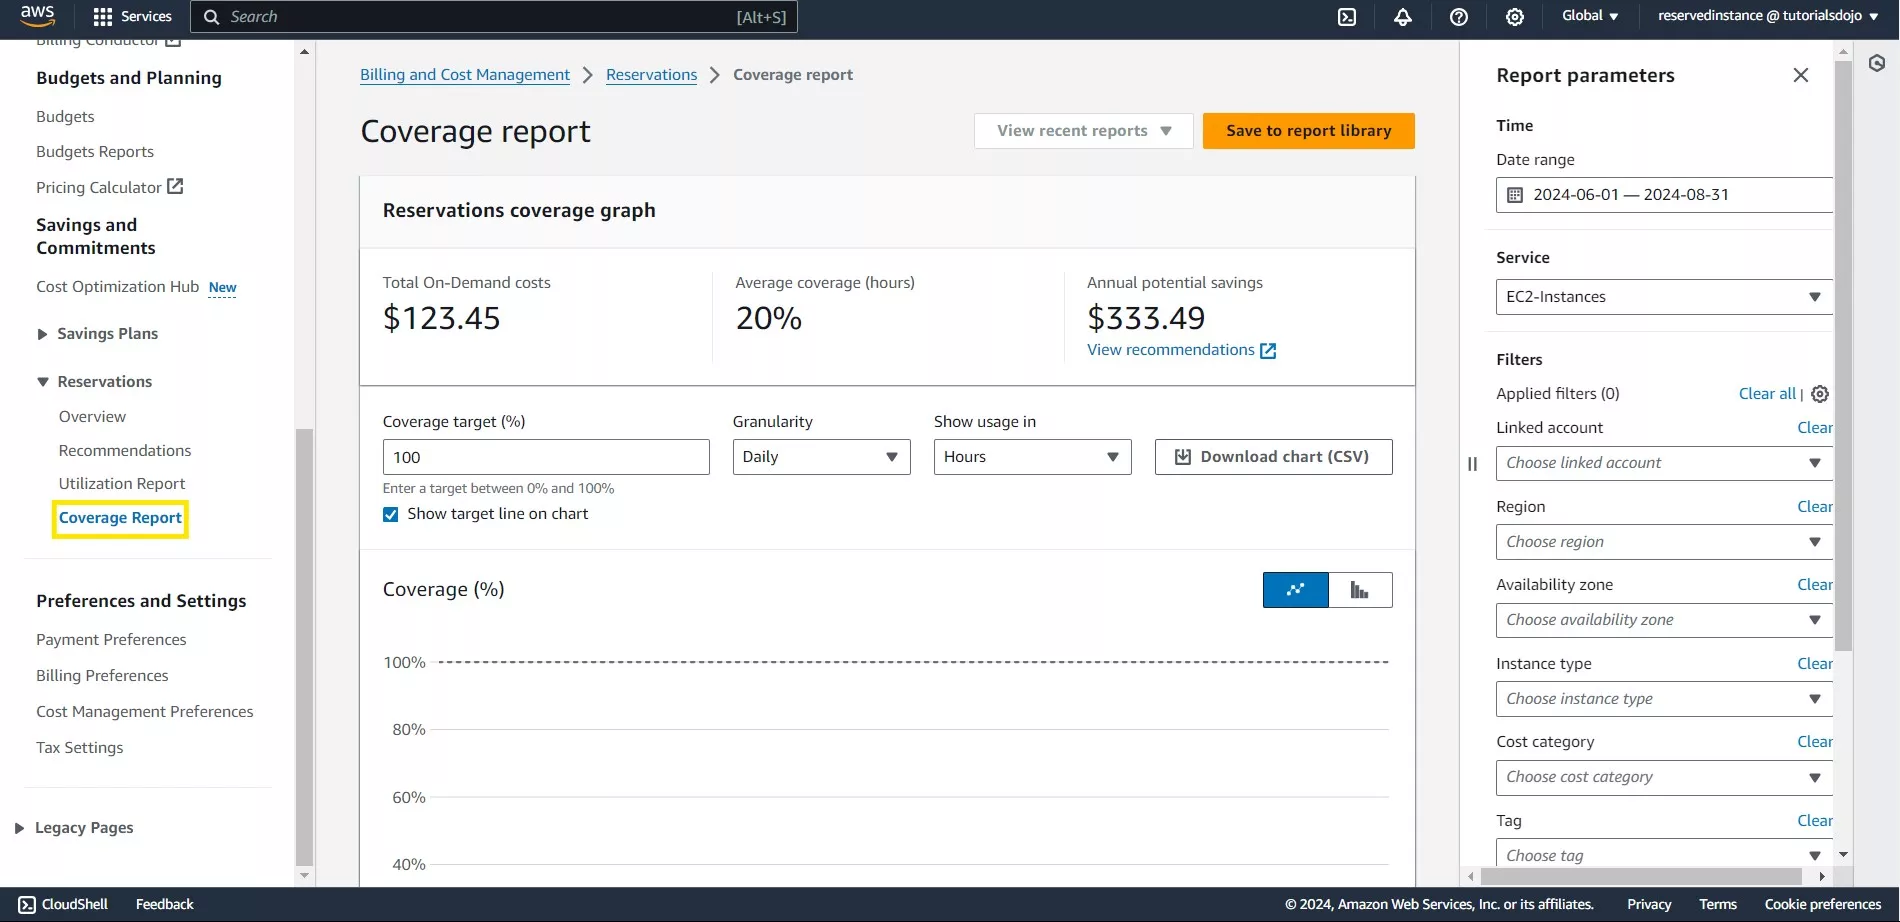
Displayed above is an example of the RI Coverage Report interface. It displays the Total On-Demand cost, the annual potential savings, and the important data here which is the Average coverage. Unlike in RI Utilization, you can already see here what your RI Coverage is even if you don’t view the graph. But for visual representation, you can still edit the graph below to display your RI Coverage based on your desired period (data range), linked account, region, availability zone, and other filters located on the righthand side. A 20% average coverage means that only 20% of your instances are covered by the Reserved Instances. This indicates that most of your instances are still using On-Demand and it provides you an opportunity for optimization of your instances.
Computing for both RI Utilization and RI Coverage
What if the AWS Billing and Cost Management is down or unavailabe? Or what if there’s no AWS services that can provide you data about your RI Utilization and Coverage? Don’t worry—computing for both these metrics can be done manually and easily by you! Here’s how you can do it:
To compute for RI Utilization, you can use the following formula:
RI Utilization: (RI Usage Hours / Total RI Purchased Hours) x 100%
- RI Usage Hours: This represents the total hours that your Reserved Instances were actively utilized during your reporting period.
- Total RI Purchased Hours: This is the total number of hours your Reserved Instances were available for use, calculated as the number of instances multiplied by the hours in the reporting period.
For the RI Coverage, you can use this formula:
RI Coverage: (RI Usage Hours / Total Instance Usage Hours) x 100%
- Total Instance Usage Hours: This is the sum of all the usage hours of all your EC2 instances, including both On-Demand and Reserved Instances.
For you to determine if you are effectively using your Reserved Instances, your computed RI Utilization and RI Coverage should both be close to or equal to 100%. An RI Utilization of 100% means that you are making full use of your RIs, effectively optimizing. While an RI Coverage of 100% means that your total instance usage is fully covered by Reserved Instances. And this is all while benefiting from their associated lower costs as compared to the On-Demand instances.
Importance of these Metrics
In conclusion, there are noticeable differences between these two metrics but both are crucial in managing your AWS resources. If you are running a long-term workload while at the same time being economical, there’s no better choice but to utilize Reserved Instances over On-Demand and other Instance Purchasing Options. By aiming for higher values on both of these metrics, you can maximize the benefits that it provides. This will help you plan your cloud resource better while maintaining your financial capability for future optimizations.
References:
- https://docs.aws.amazon.com/whitepapers/latest/cost-optimization-reservation-models/aws-cost-explorer.html
- https://www.amazonaws.cn/en/aws-cost-management/reserved-instance-reporting/

48 Hour FLASH SALE – 10% OFF ALL PLANS. Use Coupon Code: TD-PLAYCLOUD-0925

Founder Spotlight: Jon Bonso

Enroll Now – Our Google Cloud Certification Exam Reviewers

Tutorials Dojo Exam Study Guide eBooks

FREE AWS Exam Readiness Digital Courses

Subscribe to our YouTube Channel

FREE AWS, Azure, GCP Practice Test Samplers