Last updated on January 25, 2024
We can almost do everything now on the website. Selling clothes, ordering food, video posting, doing business meetings, online classes, and others, you name it. Running a website is very awesome and at the same time hard, especially when bad actors want to mess with it. One sneaky way is an “HTTP Flood Attack,” where your website gets bombarded with too many requests. This can slow down or even break your site. Detecting and responding to such attacks promptly is crucial for maintaining the availability and performance of your applications.
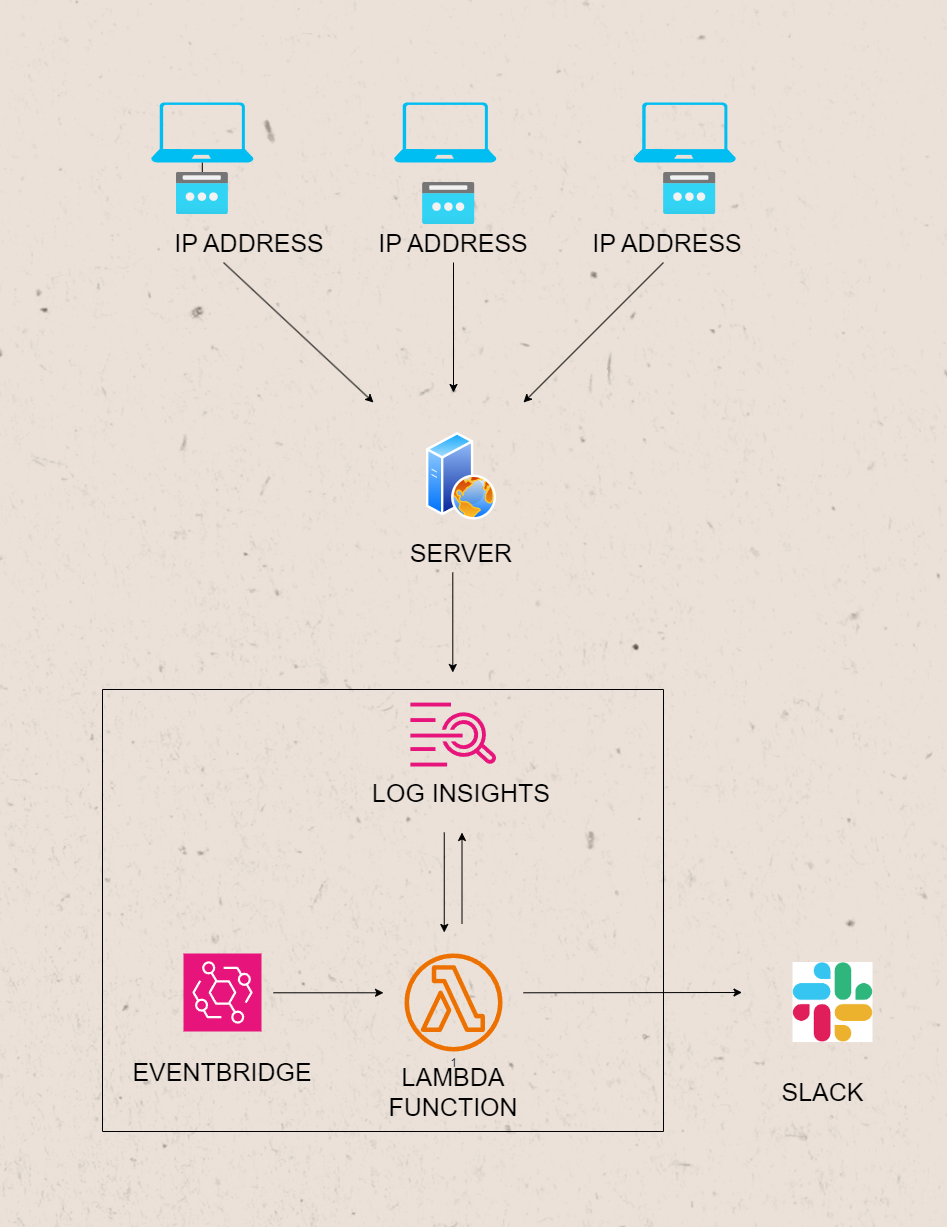
In this blog post, we’ll explore how to implement a simple automated HTTP flood attack notification system using AWS Lambda, Amazon EventBridge, CloudWatch Logs Insights, and Slack. By leveraging the power of these AWS services, we can create a simple event-driven solution to detect and notify when an abnormal number of requests are received from a specific IP address. The following diagram illustrates the basic structure of our architecture.
HTTP Flood Attack Notification Prerequirements
1. AWS Lambda
AWS Lambda is a serverless computing service that lets you run your code without provisioning or managing servers. We’ll use Lambda to execute a CloudWatch Logs Insights query, which analyzes logs generated by our web server.
2. Amazon EventBridge
Amazon EventBridge serves as a serverless event bus service designed to facilitate seamless communication between diverse applications through event-driven architecture. In our specific use case, EventBridge plays a pivotal role by regularly triggering our Lambda function. This Lambda function is strategically employed to monitor and detect potential HTTP flood attacks. By harnessing the power of events, we establish an efficient and responsive mechanism to safeguard our system against such security threats.
3. CloudWatch Logs Insights
CloudWatch Logs Insights enables us to search and analyze log data. We’ll use it to query the logs generated by our web server, identifying IP addresses with an abnormal number of requests. Make sure all your website logs are sent to CloudWatch. It’s like collecting all the evidence in one folder.
4. Slack
Slack, our communication lifeline, serves as the platform for receiving immediate notifications. Our Lambda function will leverage Slack to alert us promptly when suspicious activity is detected.
Implementation Steps
Writing our code in AWS Lambda
Imagine a robot that reads through your logs and raises a flag if it sees something fishy. This will be the job of our AWS Lambda function. We’ll write a Lambda function in Python that executes a CloudWatch Logs Insights query to identify IP addresses with a high number of requests.
Here’s a step-by-step guide:
-
Go to the Lambda Console:
- Open the AWS Management Console
- Navigate to the Lambda service.
-
Create Function:
- Click on the “Create function” button.
-
Configure Function:
- Choose “Author from scratch.”
- Provide a name for the function.
- Choose a runtime (e.g., Python).
- Choose an existing role or create a new role with the necessary permissions.
- Click “Create function.”
-
Function Code:
- In the “Function code” section, you can either copy and paste your Python code into the inline code editor.
- In the “Function code” section, you can either copy and paste your Python code into the inline code editor.

Here is a simple code we can use and how it works:
- These lines below import necessary libraries and modules for working with AWS (Amazon Web Services), handling date and time, working with JSON data, managing environment variables, and making HTTP requests.
import boto3
from datetime import datetime, timedelta
import json
import time
import os
import urllib3
- This function
send_slack_notificationtakes a Slack webhook URL and a message, converts the message to JSON format, and sends a POST request to the specified Slack webhook URL using the urllib3 library.
def send_slack_notification(webhook_url, message):
    # Send the notification sa Slack
    http = urllib3.PoolManager()
    response = http.request('POST', webhook_url, body=json.dumps(message), headers={'Content-Type': 'application/json'})
    print(response.status, response.reason)
- This is the main Lambda function, named
lambda_handler, which is the entry point for AWS Lambda. It retrieves Slack webhook URL and log group name from environment variables. We use environmental variables here, to secure important links and secrets that we cannot publicly show.
def lambda_handler(event, context):
    slack_webhook_url = os.environ['SLACK_WEBHOOK_URL']
    log_group_name = os.environ['LOG_GROUP_NAME']
- These lines below create an AWS CloudWatch Logs client using the boto3 library and a query written in CloudWatch Logs Insights Query Language. It retrieves and processes log data from CloudWatch Logs to find the top IP addresses based on the number of requests. This query is just an example you can use, tailor it accordingly to your use.
    client = boto3.client('logs')

    query = """fields @timestamp, @message

        | parse @message "[*] * * * * * * * * * [*] * *" as timestamp, IPaddress, httpMethod, statusCode, separator, requestMethod, referrer, upgradeHeader, site, requestURL, userAgent, upstream_response_time, request_time
        | stats count() as numberOfRequest by IPaddress
        #exclude Route53 IP
        | filter IPaddress not like /^52.95.\b(0|[1-9]|1[0-5])\b.([0-9]{1,3})$/
        | filter IPaddress not like /15\.177\.([0-9]|[1-5][0-9]|6[0-3])\.\d{1,3}/
        | sort numberOfRequest desc
        """
- This initiates a query to CloudWatch Logs by specifying the log group name, start time, end time, and the query string. Then, it retrieves a query ID for further processing.
    start_query_response = client.start_query(
        logGroupName=log_group_name,
        startTime=int((datetime.today() - timedelta(minutes=5)).timestamp()),
        endTime=int(datetime.now().timestamp()),
        queryString=query,
    )
   query_id = start_query_response['queryId']
- The next line of codes waits for the query to complete and retrieves the results. It then converts the response to a JSON object. You can omit
print()with the comment, “for testing”, by deleting it, the use of this line of code is so that we see where our code is done processing and what kind of data we are dealing with. In this case(or at least when I am doing the test), theprint('response: ', results_json_object)shows that the query result from the lambda receives is a list of lists.
    response = None
    while response is None or response['status'] == 'Running':
        print('Waiting for query to complete ...') # for testing
        time.sleep(1)
        response = client.get_query_results(queryId=query_id)
        response_string = str(response).replace("'", '"')
        results_json_object = json.loads(response_string)
        print('response: ', results_json_object)   # for testing
- This is a loop for testing purposes, printing the IP addresses and their corresponding number of requests from the query results. These lines are just like the above test line code print(), to show what our code is processing. You can omit this loop after you are done testing.
    #for testing purposes
    for counter_test, result_set_test in enumerate(results_json_object["results"]):
        print("#", counter_test+1)
       for pair_test in result_set_test:
            IPaddress_test = pair_test['field']
            numberOfRequest_test = pair_test['value']
            print(f"{IPaddress_test}: {numberOfRequest_test}")
- This loop processes the results and creates a dictionary (
ip_request_dict) with IP addresses as keys and their corresponding number of requests as values. Sort the dictionary by values (number of requests) in descending order. And gets the current time and a timestamp representing the start of a 5-minute interval.
    # Dictionary to store IP addresses and their corresponding number of requests
    ip_request_dict = {}
    for result_set in results_json_object["results"]:
        ip_address = None
        num_requests = None
        for pair in result_set:
            if pair['field'] == 'IPaddress':
                ip_address = pair['value']
            elif pair['field'] == 'numberOfRequest':
                num_requests = pair['value']
       # Check if both IP address and number of requests are available
        if ip_address and num_requests:
            # Store in the dictionary
            ip_request_dict[ip_address] = int(num_requests)
          sorted_ip_request_dict = dict(sorted(ip_request_dict.items(), key=lambda item: item[1], reverse=True))
          current_time = datetime.now().strftime('%Y-%m-%dT%H*3a%M*3a%S.000Z')
          current_date_start = (datetime.now() - timedelta(minutes=5)).strftime('%Y-%m-%dT%H*3a%M*3a%S.000Z')      # five minutes time interval
- Lastly, these coming lines create and send a Slack notification for the top 20 IP addresses with high numbers of requests. Returns a successful response with a status code of 200. You can modify this to your liking.
    # Create Slack messages for the top 20 IP addresses
    for ip_address, num_requests in list(sorted_ip_request_dict.items())[:20]:
        if int(num_requests) > 20:   #set to 100 for actual, 20 for test
            message = {
                'text': f":warning: High Number of Requests Detected coming from {ip_address}\n"
                    f":earth_africa: IP Address: {ip_address}\n"
                    f"\n"
                    f"\n"
                    f":earth_africa: IP Address: {ip_address}\n"
                    f":point_right: Initial Check: https://www.abuseipdb.com/check/{ip_address}\n"
        }
        send_slack_notification(slack_webhook_url, message)
    return {
        'statusCode': 200,
        'body': "Success"
Setting the right configurations and permission
-
Environment Variables:
- Our function relies on environment variables, so we need to set them in the “Environment variables” section. For this specific code, set the
SLACK_WEBHOOK_URLandLOG_GROUP_NAMEvariables.
- Our function relies on environment variables, so we need to set them in the “Environment variables” section. For this specific code, set the
-
Execution Role:
- In the “Execution role” section, make sure the role has the necessary permissions to read logs and execute CloudWatch Logs Insights queries.
-
Advanced Settings:
- Configure other settings like memory, and timeout, based on your requirements. In our case, I adjusted the timeout accordingly.
-
Deploy and Test:
- Click “Deploy” to save and deploy our Lambda function configuration.
- We can test our function manually by clicking “Test” and providing a sample event. This part is one of the very important parts as this will shows where we will adjust the code and configuration based on the test results. This is where the test code lines we have written shine.
Schedule Regular Checks to Detect HTTP Flood Attacks using EventBridge
We will set up, next, the EventBridge to tell our robot to check the logs every 5 minutes. Like a security guard making rounds. Here are the steps on how to set it up.
-
Create a Rule in EventBridge:
- Go to the AWS Management Console and navigate to the EventBridge service.
- Click on “Rules” in the left navigation pane.
- Click “Create rule.”
- Enter a name for your rule.
- Set up your rule pattern or event source. In our case, I set it up to trigger the lambda every 5 mins using this setting, ” cron(0/5 * * * ? *)”.
- Choose the Lambda function as the target.
-
Configure Lambda as a Target:
- In the “Configure input” section of the rule creation, select “Lambda function” as the target.
- Choose the Lambda function we created earlier.
- Set any additional parameters based on your use case.
- Click “Create.”
-
Enable the Rule:
- Once the rule is created, make sure to enable it if it’s not enabled by default.

Get a Heads-Up on Slack during HTTP Flood Attacks
We teach our robot to send us a quick message on Slack if it finds anything suspicious. It’s like your site’s personal guard dog barking when it sees something odd. If you don’t know how and where to get the webhook URL, then see the steps below.
-
Create a Slack App:
- Go to the Slack API website: https://api.slack.com/.
- Navigate to “Your Apps” and click “Create New App.”
- Fill in the required information for your app.
-
Create an Incoming Webhook:
- In your Slack app settings, click on “Incoming Webhooks” under “Add features and functionality.”
- Activate Incoming Webhooks.
- Click “Add New Webhook to Workspace” and select the channel where you want to send messages.
- Click “Authorize.”
-
Copy the Webhook URL:
- Once the webhook is created, copy the generated Webhook URL and add it to the environmental variables in the lambda function
Monitor
Lastly, all that’s left is to monitor the CloudWatch Logs Insights query results and Slack notifications to ensure the system is functioning as expected.
Conclusion – Why do a HTTP Flood Notification Matter?
Bad things can happen online, but with these simple tools from AWS, you can be the superhero for your website. By catching these attacks early, you can keep your site safe and sound. Just a few clicks, and you’re the guardian of your digital castle!
🤖 $3.49 eBooks Start Here – Get Up to 30% OFF All AI & Machine Learning Reviewers

Turn Your Team Into Cloud-Ready Professionals Today

Learn AWS with our PlayCloud Hands-On Labs

$2.99 AWS and Azure Exam Study Guide eBooks

New Claude Certified Architect Foundations CCA-F

Learn GCP By Doing! Try Our GCP PlayCloud

Learn Azure with our Azure PlayCloud

FREE AI and AWS Digital Courses

FREE AWS, Azure, GCP Practice Test Samplers


Subscribe to our YouTube Channel

Follow Us On Linkedin