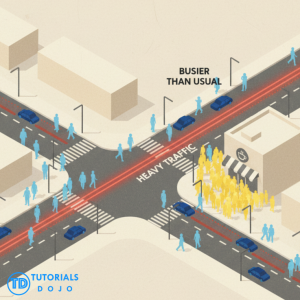
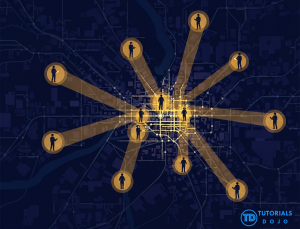
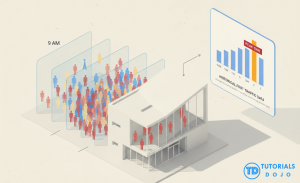
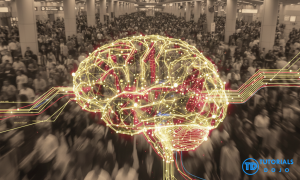
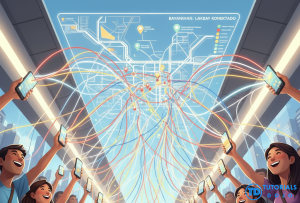
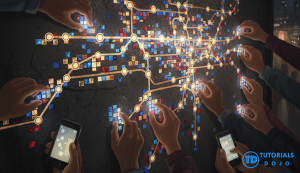
You might use Google Maps in your daily commute, but have you ever wondered how it provides real-time traffic data? Or how it highlights the busiest areas and even the popular times for a business? To achieve this, Google powers these features with large-scale analysis and crowdsourcing from our smartphone location data. Subsequently, an artificial intelligence (AI) application is used to also predict crowd levels in the coming hours and days, instead of being limited to real-time situations. Google Maps’ features for live busyness, popular times, and traffic are a suite of AI-powered systems. Specifically, they are built on crowdsourcing and machine learning to interpret anonymous, aggregated location data. This process gives us real-time information and predictions for crowd detection. All these features highlight the integration of large-scale location from our phones worldwide. With data analysis, we are served with real-time information on crowds and the movement of people. And by integrating artificial intelligence (AI), these analyses provide real-time information and predictions of traffic, busy areas, and crowds. This information makes our lives easier and relieves us from the stress of uncertainty in our daily commutes. At its core, Google Maps detects crowds by analyzing aggregated and anonymized location data. This information comes from smartphone users who have opted to share their location history. Consequently, this vast dataset fuels the machine learning models that identify patterns in movement and density, leveraging the large scale of Google Maps users. For Popular Times and Live Busyness: For Traffic and Congestion: Ultimately, a key use case for AI in data analysis is pairing it with large-scale data. This partnership allows for innovations that provide real-time insights and future predictions about crowd levels. However, these applications primarily use smartphone location data. Beyond this, another method for crowd analysis involves interpreting images. Public transportation in the Philippines often involves long lines and crowded trains, particularly during rush hour. Commuters face the problem of not knowing how congested a station is until they arrive. The dread of “rush hour” as you race with other commuters to go home. But what if you could know how congested the station was before you even left your home? In 2016, the local transit app Sakay.ph addressed this problem with its Traincheck feature. It used public CCTV feeds from Manila’s MRT-3 stations and applied computer vision, a field of AI that trains models to interpret visual information, to provide commuters with near-real-time crowd updates. By routinely capturing an image from the camera streams, Sakay.ph evaluates the crowd levels at a given time across the stations of MRT-3. The approach by Sakay.ph highlights the core task of image-based crowd detection. The technology to achieve this has evolved dramatically, from simple counting to a more nuanced understanding of entire scenes: from simple counting to a more detailed analysis of crowds. Again, we leverage rich data sources like images and videos by applying artificial intelligence models to understand them. This allows us to create automated AI solutions that determine crowd levels from live camera feeds. Despite the challenges in computer vision, artificial intelligence research continues to advance, helping us craft better solutions for understanding crowds in images and videos. Artificial intelligence is flexible enough to provide helpful information for our day-to-day needs, whether from large-scale location data from smartphones or camera feeds already in establishments. And we will see further that in situations where data is lacking, we as part of the community can contribute to these innovations. While Google Maps accesses large-scale location data and Sakay.ph harnesses AI computer vision, another approach to the problem exists. This method leverages direct human collaboration through crowdsourcing. Both Google Maps and Sakay.ph already provide avenues for community-driven data to improve their solutions, for example, by allowing users to report errors. Nevertheless, a purely crowdsourced approach to detect crowd levels is another avenue worth exploring. After all, if we lack the data we need to generate insights on crowd levels, why not start generating them? All through the help of the commmunity. Machine learning models can only do so much given the scale and quality of available data. And the community-driven approach helps create and enhance data through the individual efforts of people, providing an avenue to produce more quality data that AI models are hungry for. The crowdsourcing approach, utilizing contributions and reports from the community, has recently powered an emerging traffic-solutions application in the Philippines: Rush PH. Tackling the traffic problem by empowering commuters to contribute and use information from their fellow commuters. This empowerment gives commuters control and proactivity in managing their daily commutes. Commuters already move together; why can’t we all work together to help build an easier experience for our commutes? Rush PH uses user-submitted reports from transit passengers, instead of the apporach of Sakay.ph with camera streams which are no longer available. Through the app, commuters can report crowd conditions and train arrivals, which generates a historical and real-time overview of the transit situation. This community-driven solution highlights the effectiveness and untapped potential of user-generated data. Given the almost half a million daily ridership of MRT and LRT lines, understanding crowds by crowdsourcing data from commuters leaves a lot of room for innovation. All while being independent from externally provided data that could suddenly be removed (MRT-3’s removal of public CCTV) or require access to wide scale location data from smartphones (Google Maps). It is in principle our “bayanihan” spirit: crowd intelligence of the people, by the people, for the people. Be it location data from millions of smartphones, video from CCTV streams, or direct reports from the community itself, all these rich data sources can be used to help ease the movement of commuters. Data from smartphone locations, CCTV footage, and direct community reports can all be used to generate practical information. The same problem tackled in a variety of innovatiave approaches. Next time you use Google Maps to avoid traffic, check when an establishment is the busiest to avoid long wait lines, or use an app to gauge the crowd at your local train station, you will get to appreciate how all of our crowdsourced information—whether gathered passively by AI or shared actively by people—contributes towards these features we often take for granted. By combining the large-scale presence of crowd information with the power of AI and community collaboration, we can create and share innovations that help people live better lives.
How Google Maps Detects Crowds: A Look Inside

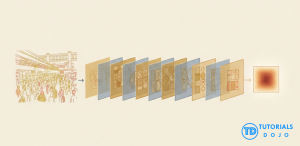
Understanding Crowds in Images: A Commuter’s Dilemma
From Pixels to People: The AI’s Evolution
The Power of the People: A Community-Driven Approach
Conclusion

References
🎉 PlayCloud Sale Extension – Get 10% OFF and Save Big on All PlayCloud Subscription Plans!

Learn AWS with our PlayCloud Hands-On Labs

$2.99 AWS and Azure Exam Study Guide eBooks

New AWS Generative AI Developer Professional Course AIP-C01

Learn GCP By Doing! Try Our GCP PlayCloud

Learn Azure with our Azure PlayCloud

FREE AI and AWS Digital Courses

FREE AWS, Azure, GCP Practice Test Samplers


Subscribe to our YouTube Channel

Follow Us On Linkedin


Duncan F. Bandojo is a undergraduate of Computer Science at Polytechnic University of the Philippines, with an interest in backeend development and geospatial data analysis, and is currently diving into frontend development. He is passionate about building applications that leverage visual data (geospatial) to provide visual insights that genuinely helps people.