Imagine a bustling city with a vast network of roads and highways connecting every corner. Like this intricate transportation system, the cloud computing world has its complex web of virtual networks, facilitating the seamless flow of data and communication. In this digital metropolis, ensuring security and maintaining visibility over network traffic is paramount. AWS (Amazon Web Services) offers a powerful tool called VPC Flow Logs to help you navigate and monitor the virtual pathways within your cloud environment.
As you embark on your cloud journey, understanding VPC Flow Logs can be a game-changer. This feature lets you capture valuable information about the IP traffic traversing the network interfaces within your Virtual Private Cloud (VPC). Gaining insights into this data flow can unlock a world of possibilities – from optimizing network performance to fortifying your defenses against potential threats.
In this article, we’ll explore the purpose, functionality, and practical use cases of VPC Flow Logs. Additionally, we’ll walk through a step-by-step guide on how to set up and use VPC Flow Logs within AWS.
What Are VPC Flow Logs?
VPC Flow Logs is a feature within AWS that enables you to capture network-level traffic data flowing to and from network interfaces in your VPC. This traffic can be from instances like EC2 (Elastic Compute Cloud) instances or other services interacting within your VPC. Importantly, VPC Flow Logs provide metadata about this traffic rather than capturing the content of the data being transmitted.
Key Data Captured by VPC Flow Logs:
- Source and Destination IP Addresses: These are the IP addresses involved in the communication.
- Ports: The source and destination ports of the traffic.
- Protocol: The communication protocol being used (e.g., TCP, UDP).
- Traffic Type: Whether the traffic is inbound or outbound.
- Action: Whether the traffic was accepted or rejected by security groups or network ACLs (Access Control Lists).
Purpose and Use Cases
The primary purpose of VPC Flow Logs is to provide visibility into the network traffic within your VPC. This data is crucial for several reasons:
-
Network Traffic Analysis: By analyzing VPC Flow Logs, you can gain insights into the traffic flow within your network. This helps understand patterns, identify bottlenecks, and optimizing network performance.
-
Security Monitoring: VPC Flow Logs allow you to monitor traffic and identify potential security threats. For example, analyzing the logs can detect unauthorized access attempts or data exfiltration activities.
-
Troubleshooting: When network-related issues arise, VPC Flow Logs provide a way to trace traffic flow and pinpoint where problems may occur. This is especially useful in complex VPC setups where multiple components interact.
-
Compliance and Auditing: VPC Flow Logs can help meet regulatory and compliance requirements by providing an audit trail of network traffic.
The Granularity of VPC Flow Logs
It’s important to note that VPC Flow Logs offer a high-level overview of network traffic. They capture metadata, such as IP addresses, ports, and protocols, but do not capture the actual content of the traffic or application-level details. This granularity makes them useful for general network monitoring, but they are not a replacement for more detailed packet capture tools if deep inspection is required.
Setting Up VPC Flow Logs in AWS
Now that we understand what VPC Flow Logs are and their use cases let’s look at a practical example of how to set them up in AWS.
Step 1: Navigate to the VPC Dashboard
- Log in to the AWS Management Console.
- Go to the VPC Dashboard by searching for “VPC” in the AWS services search bar.
Step 2: Create a VPC Flow Log
- In the VPC Dashboard, select Your VPCs from the left-hand menu.
- Choose the VPC for which you want to enable flow logs.
- Click on the Actions button and select Create Flow Log.
Step 3: Configure the Flow Log Settings
-
Filter: Choose the type of traffic you want to capture. You can select All, Accepted, or Rejected traffic.
-
Destination: Decide where you want the logs to be sent. You can send them to:
- Amazon CloudWatch Logs: For real-time monitoring and alerting.
- Amazon S3: For long-term storage and analysis.
- Amazon Data Firehose (in the same or a different account): For streaming and processing the log data.
-
IAM Role: Select an IAM role that allows the VPC Flow Logs service to publish logs to your chosen destination. If you don’t have one, you can create a new role.
To create a VPC Flow Logs IAM role with the necessary permissions, you need to grant the role the ability to publish logs to your chosen destination, such as Amazon CloudWatch Logs or Amazon S3. Below is an example of an IAM role with the trust relationship and permissions required for CloudWatch Logs and S3.
Trust Relationship Policy: This policy allows the VPC Flow Logs service to assume the role.
{ "Version": "2012-10-17", "Statement": [ { "Effect": "Allow", "Principal": { "Service": "vpc-flow-logs.amazonaws.com" }, "Action": "sts:AssumeRole" } ] }Permissions Policy for CloudWatch Logs: This policy grants the role permission to publish logs to CloudWatch Logs.
{ "Version": "2012-10-17", "Statement": [ { "Effect": "Allow", "Action": [ "logs:CreateLogGroup", "logs:CreateLogStream", "logs:PutLogEvents", "logs:DescribeLogGroups", "logs:DescribeLogStreams" ], "Resource": "*" } ] }Permissions Policy for S3: This policy permits the role to deliver logs to an S3 bucket.
{ "Version": "2012-10-17", "Statement": [ { "Effect": "Allow", "Action": [ "s3:PutObject", "s3:GetBucketAcl", "s3:GetBucketLocation" ], "Resource": "arn:aws:s3:::your-bucket-name/*" } ] } - Log Format: You can use the default log format or customize it to include additional fields, such as the packet size or the instance ID.
Step 4: Review and Create
Review your configuration settings and click Create Flow Log. Once created, your VPC Flow Logs will begin capturing traffic data based on your configured settings.
Practical Example: Monitoring Traffic to Detect Anomalies
Imagine running a web application in your VPC and noticing unusual spikes in outbound traffic from one of your EC2 instances. By setting up VPC Flow Logs, you can capture detailed information about the traffic, including the source and destination IP addresses, ports, and the action taken (e.g., accepted or rejected).
Example Scenario:
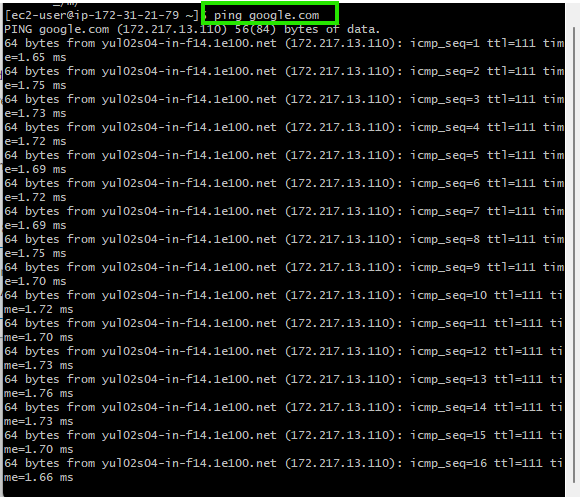
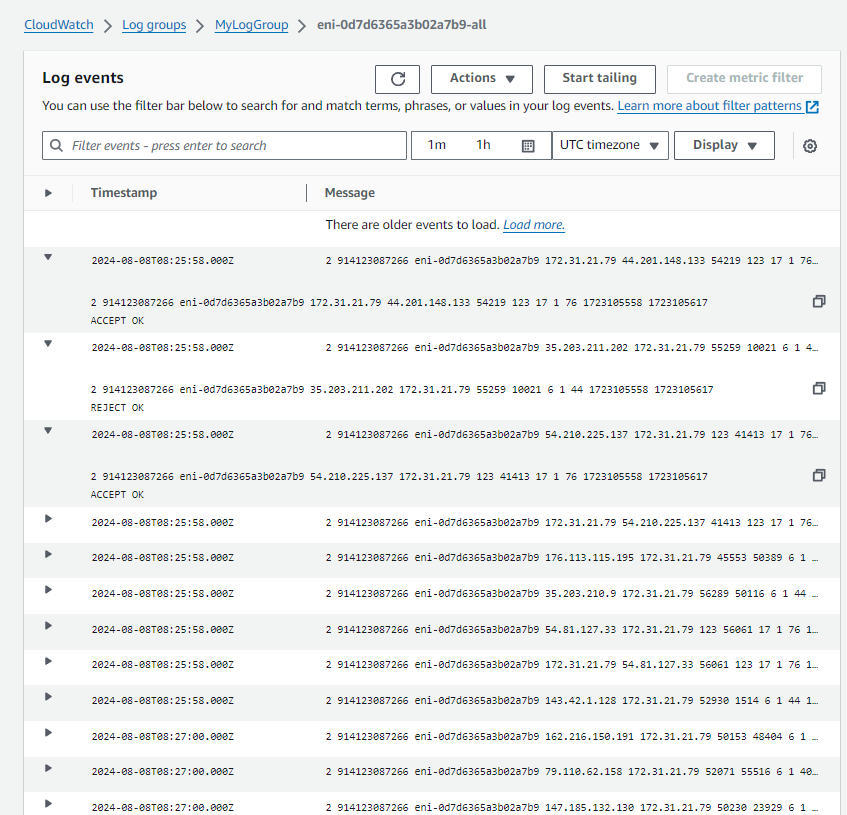
In this scenario, an EC2 instance within the VPC is used to ping an external address (google.com). The ping the command is executed on the EC2 instance, and the network activity is captured in the VPC Flow Logs, as shown below:
-
Ping Command Execution: The user runs
ping google.comfrom the EC2 instance.
-
Captured VPC Flow Logs: The corresponding network activity is captured in the VPC Flow Logs, as depicted in the following screenshot:
In the logs, you can observe the following details:- Source IP: The IP address of the EC2 instance (
172.31.21.79). - Destination IP: There are multiple destination IPs logged:
44.201.148.13354.210.225.137- These IPs correspond to the external servers that
google.comresolved during the ping.
- The log events include both
ACCEPTandREJECTactions, indicating that some traffic was allowed while other traffic was denied.
- Source IP: The IP address of the EC2 instance (
Investigating Security Incidents
By analyzing VPC Flow Logs, you can detect and respond to potential security incidents. For example, unexpected communication with external IPs or traffic on unusual ports could indicate a security breach or data exfiltration attempt.
You can filter the logs to focus on REJECT actions that indicate blocked traffic. This allows you to investigate if any unauthorized access attempts were prevented by your security groups or network ACLs.
Best Practices and Advanced Tips
While VPC Flow Logs provide valuable insights into your network traffic, there are several best practices and advanced tips to consider:
-
Leverage CloudWatch Metrics and Alarms: AWS provides CloudWatch metrics for VPC Flow Logs, allowing you to monitor and set alarms for specific traffic patterns or anomalies.
-
Integrate with Third-Party Tools: VPC Flow Logs can be integrated with third-party security and monitoring tools for more advanced analysis and visualization.
-
Optimize Log Retention: Determine the appropriate log retention period based on your requirements and budget. AWS offers different storage options, such as S3 and CloudWatch Logs, with varying retention periods and costs.
-
Automate Log Analysis: Consider using AWS Lambda functions or other automation tools to process and analyze VPC Flow Logs in real-time, enabling faster response times to potential issues.
-
Combine with Other AWS Services: VPC Flow Logs can be combined with other AWS services, such as AWS Config, AWS CloudTrail, and Amazon GuardDuty, for a more comprehensive security and compliance solution.
Conclusion
VPC Flow Logs are invaluable for monitoring and analyzing network traffic within your AWS environment. By providing metadata about the traffic flow, they enable network analysis, security monitoring, and troubleshooting. The setup process is straightforward, and the logs can be sent to CloudWatch or S3 for further analysis.
Whether you ensure your network is secure, optimize traffic, or meet compliance requirements, VPC Flow Logs offer the visibility you need to manage your VPC effectively.
Following the steps outlined in this article and implementing the best practices and advanced tips, you can start capturing and analyzing your VPC traffic, gaining deeper insights into your AWS environment.
To further explore VPC Flow Logs and other AWS networking services, refer to the official AWS documentation.
References:
https://docs.aws.amazon.com/vpc/latest/userguide/flow-logs.html
https://aws.amazon.com/blogs/aws/vpc-flow-logs-log-and-view-network-traffic-flows/


