Last updated on October 24, 2025
Are you a beginner wanting to start your very first data science or machine learning project, but don’t have the right hardware or enough storage capacity? Well, Kaggle is the perfect platform to start your journey! Kaggle is a powerful web-based platform that provides opportunities for data scientists/analysts and machine learning enthusiasts to collaborate with the community, find and publish datasets, and grow their skills through competitions. Just like Google Colab, this platform provides cloud-based notebooks so you can run your code directly without installing Python, Jupyter or other heavy dependencies/libraries. Kaggle also offers GPU and TPU acceleration to give high-performance access for free. In short, Kaggle eliminates the hardware barrier that limits anyone to learn, practice and showcase their data science or machine learning skills. Kaggle Notebooks are complete interactive environments where you can write and execute code in Python or R. They come with pre-installed libraries such as NumPy, Pandas, TensorFlow, PyTorch, and scikit-learn. Kaggle hosts over 100,000 public datasets across industries from healthcare to finance to sports. You can explore, visualize, and use these datasets in your personal projects or competitions. Under the “Models” section, Kaggle provides a hub where users can build, train, and publish machine learning models. You can browse models built by others, reuse them, or share your own for collaboration. Kaggle competitions are what made the platform famous. Participants from all over the world compete to solve data-driven problems, often for cash prizes or recognition from top companies. Leaderboards let you see how your model ranks globally. This is a great way to learn from others and improve your skills. Kaggle Benchmarks allow you to evaluate the performance of your models against public baselines. It helps you gauge how well your approach performs compared to others in the community. The Code section lets you explore and fork other users’ code notebooks. This is an important resource for beginners. You can learn directly from real-world examples and adapt them for your own projects. The community. The Discussion forums are the heart of Kaggle’s collaborative environment. You can ask questions, share ideas, or seek feedback from experienced data scientists and peers. Kaggle Learn provides short, hands-on courses in Python, machine learning, data visualization, and AI fundamentals. It’s perfect for beginners who want structured, bite-sized lessons. Difficulty: Beginner In this walkthrough, we’ll create a simple data analysis and perform a linear regression prediction, covering the basic workflow of data science. Don’t worry if you’re a beginner in data science, machine learning, or even Python,because everything will be explained step by step. Visit Kaggle.com and either create an account or sign in to your existing one. Once logged in, click “New Notebook.” This opens a cloud workspace where you can write and execute Python code directly in your browser. We’ll use a sample dataset of restaurant sales: 🔗 Restaurant Sales Sample Dataset You can download it via: If you downloaded the dataset as a zip file, extract it and upload the .csv file to the Input section of your Kaggle Notebook. You’ll find this option in the right panel of the notebook interface. In this step, we’ll import the required libraries and load the dataset into a DataFrame. Replace the default code. You can inspect your dataset to confirm that it loaded properly. Click the play button on the top-left corner of the code cell to run it and view results. Now that your data is ready, let’s visualize revenue by location using Seaborn. Add another code cell. Next, we’ll train a simple linear regression model to predict a restaurant’s revenue. Add another code cell. A Linear Regression model simply helps summarize and study the relationship between two continuous variables. Mean Absolute Error (MAE) shows how accurate your predictions are. In this example, an MAE of ₱90.92 means the model’s predictions differ from the actual revenue by about ₱90.92 on average. You’ve successfully created your first data science project on Kaggle! You can now: Try beginner competitions such as the Titanic Machine Learning Competition Here’s what you accomplished in this walkthrough: Tip: Continue practicing by testing new datasets, adding more features, or trying different algorithms to strengthen your machine learning foundation. Kaggle is more than just a data science platform. It’s an entire ecosystem for learning, experimenting, and competing. Whether you’re a beginner exploring your first dataset or an experienced developer refining your models, Kaggle provides the resources, tools, and community to help you grow, all without worrying about hardware requirements!
What is Kaggle?
Why Kaggle?
Features of Kaggle
Notebooks

Datasets
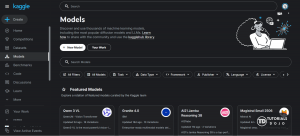
Models
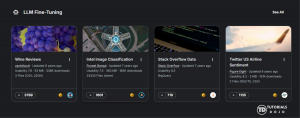
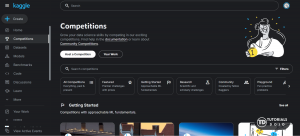
Competitions and Leaderboards

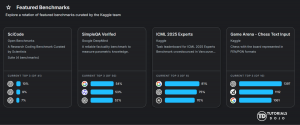
Benchmarks
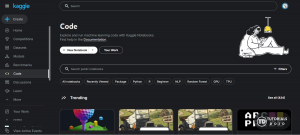
Code
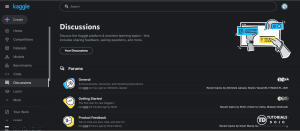
Discussion
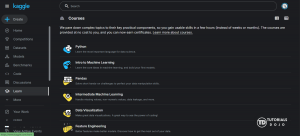
Learn
Walkthrough: Build Your First Project
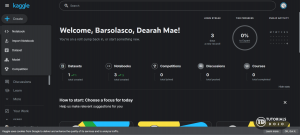
Step 1: Create or Sign in to Your Kaggle Account
Step 2: Create a New Notebook
Step 3: Download the Dataset
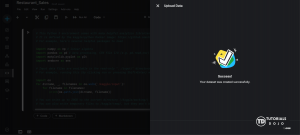
Step 4: Upload the Dataset
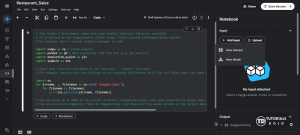
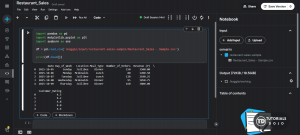
Step 5: Import Libraries and Load the Dataset
import pandas as pd
#imports the Pandas library

import matplotlib.pyplot as plt
#imports the Matplotlib plotting library's Pyplot module for creating visualizations

import seaborn as sns
#imports the Seaborn library, which provides a high-level interface for drawing attractive statistical graphics

df = pd.read_csv('/kaggle/input/restaurant-sales-sample/Restaurant_Sales - Sample.csv')
#this is just loading your dataset into a dataframe using panda’s read_csv function
Step 5.1: (Optional) Check the Dataset
print(df.head())
#this prints the first five rows of the dataframe,allowing you to quickly check if the data loaded correctly and see its structure.

print(df.info())
#this prints a concise summary of the dataframe
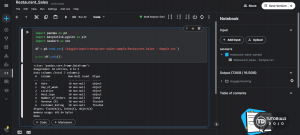
Step 6: Visualize the Revenue by Restaurant
location_revenue = df.groupby('Location')['Revenue (P)'].sum().reset_index()
#this just groups the data by the 'Location' column, calculates the sum of the 'Revenue (P)' for each restaurant, and converts the result back into a DataFrame.

sns.barplot(x='Location', y='Revenue (P)', data=location_revenue)
#creates a seaborn bar graph

plt.title('Total Revenue: Jollibee vs Mcdonalds')
#gives your graph a title

plt.show()
#displays the graph

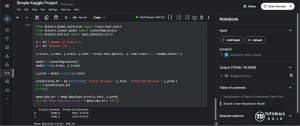
Step 7: Train a Simple Linear Regression Model
from sklearn.model_selection import train_test_split
#imports the train_test_split function from scikit-learn to split data

from sklearn.linear_model import LinearRegression
#imports the Linear Regression model class from scikit-learn

from sklearn.metrics import mean_absolute_error
#Imports the Mean Absolute Error (MAE) metric for model evaluation

x = df[['Number_of_Orders']]
#we store the Number_of_Orders column into the x variable

y = df['Revenue (P)']
#we set the revenue as the target, storing it in the y variable, because it is the value we want to predict

x_train, x_test, y_train, y_test = train_test_split(x, y, test_size=0.2, random_state=42)
#we split the data into training (80%) and testing (20%) sets. random_state=42 ensures the split is the same every time you run the code. this is commonly used but you are free to change the integer to test.

model = LinearRegression()
#this is just creating a linear regression model by calling it

model.fit(x_train, y_train)
#in here, we train the model using the percentage allocated for training data. x_train is for features and y_train contains correct answers

y_pred = model.predict(x_test)
#now the model has been trained, we will now make predictions on the test set (remember the percentage allocated for test datasets above)

predictions_df = pd.DataFrame({'Actual_Revenue': y_test, 'Predicted_Revenue': y_pred})
print(predictions_df)
print()
#this justs display the predictions by table

mean_abs_err = mean_absolute_error(y_test, y_pred)
#this computes the mean absolute error by comparing the actual test revenue (y_test) with the model’s prediction (y_pred)

print(f'Mean Absolute Error: P{mean_abs_err:.2f}')
#this just displays mean_abs_err with 2 decimal places
Step 8: Congratulations!
Quick Recap
Conclusion
Resources:
🌸 25% OFF All Reviewers on our International Women’s Month Sale! Save 10% OFF All Subscriptions Plans & 5% OFF Store Credits/Gift Cards!

Learn AWS with our PlayCloud Hands-On Labs

$2.99 AWS and Azure Exam Study Guide eBooks

New AWS Generative AI Developer Professional Course AIP-C01

Learn GCP By Doing! Try Our GCP PlayCloud

Learn Azure with our Azure PlayCloud

FREE AI and AWS Digital Courses

FREE AWS, Azure, GCP Practice Test Samplers


Subscribe to our YouTube Channel

Follow Us On Linkedin