Logging is essential in cloud monitoring, but let’s face it: Combining endless lines of log data can be a real-time disaster. Whether managing a complex infrastructure or troubleshooting an issue, finding the key insights buried in thousands of log entries can feel like searching for a needle in a haystack. That’s where the new Summarize Results feature in Amazon CloudWatch Log Insights comes in.
This game-changing update helps users instantly distill their log queries into key takeaways, saving valuable time and improving efficiency. Whether you’re analyzing performance, security events, or application behavior, Summarize Results gives you a quick snapshot of the most essential data so you can focus on what matters most.
Amazon CloudWatch is a comprehensive monitoring service designed for cloud-based environments, and one of its key features, CloudWatch Log Insights, allows users to interact with and analyze log data with the help of a powerful query language. A new feature has been added to this tool: Summarize Results. This feature provides a more efficient way to summarize and gain insights from logs directly in the CloudWatch console, making it easier for users to spot trends and resolve issues faster.
Furthermore, CloudWatch Logs Insights now utilizes Amazon Bedrock, enabling the generation of human-readable summaries from query results. Leveraging advanced Natural Language Processing (NLP) and Artificial Intelligence (AI), Amazon Bedrock provides clear, actionable insights from log data, supporting all CloudWatch Logs Insights query languages.
Key Features of the “Summarize Results” Tool
The Summarize Results button, located at the bottom of the query interface, is designed to help users generate a concise summary of their query results. This summary provides essential details such as:
-
Log Summary: A brief overview of the log data within the query’s time range. For instance, it might display high-level details about the HTTP request, the originating IP address, and the duration of responses for troubleshooting or performance monitoring.
-
Data Context: The feature includes notes about the context of the query results, including which regions the data may have been sourced from (indicating potential regional discrepancies).
-
Efficiency: By summarizing the logs, users can quickly assess whether further investigation or action is required, minimizing the need for manually sorting through large datasets.
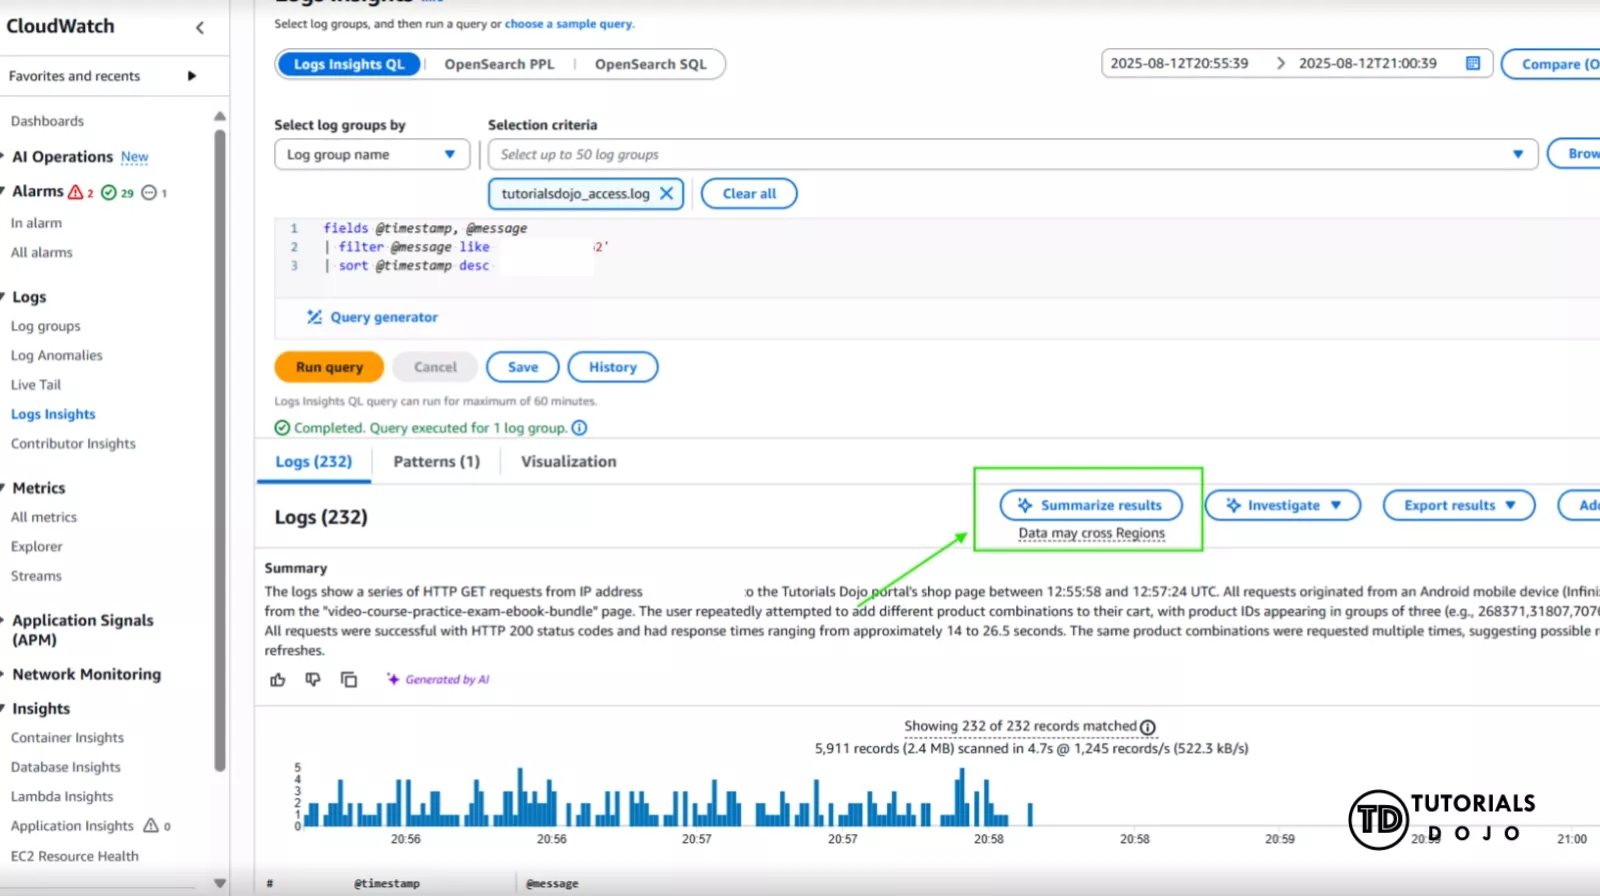
For example, in the image shared, the “Summarize Results” feature was used to analyze HTTP GET requests from a specific IP address. The log shows data about the performance of requests and retries from a mobile device, including response times and success rates. By summarizing these results, CloudWatch can instantly present this critical information in a digestible format, helping users understand application behavior or potential issues in seconds.
How “Summarize Results” Improves Log Analysis
-
Enhanced User Experience: The summarization tool streamlines the process of interpreting raw log data, particularly useful when dealing with large volumes of logs. Instead of manually sifting through records, users can now get an immediate overview of the situation, saving time and effort.
-
Faster Decision Making: By providing a snapshot of the log data’s most critical insights, this feature helps teams make quicker decisions. Whether troubleshooting performance issues or identifying error patterns, users can assess the need for additional investigation with minimal delay.
-
Cross-Region Insights: The feature also mentions when data may cross regions, ensuring users know where their log data is sourced. This is crucial in a multi-region or global deployment setup.
-
Proactive Monitoring: By summarizing query results, teams can take a more proactive approach in monitoring their cloud infrastructure. It helps detect anomalies or trends that could indicate issues like network bottlenecks or high response times, enabling quick intervention.

Why Is This a Big Help?
The Summarize Results feature is a big help for several reasons:
-
Faster Identification of Issues: This feature lets users quickly identify the most critical aspects of their logs, such as errors or patterns that may indicate an issue. There’s no need to manually filter or sort through the data, making decision-making faster.
-
Proactive Monitoring: The tool summarizes the critical parts of the logs, making it easier for teams to spot potential problems, such as network bottlenecks or high response times, before they become bigger issues.
-
No Time Wasted: There’s no need to spend extra time searching for trends or errors. It provides an overview that delivers immediate actionable insights for optimization and troubleshooting.
-
Improved Workflow: Teams’ workflows become more efficient because there’s no need for lengthy manual log analysis. Instead, the summary provides instant access to the most relevant data, enabling faster response times.
How to Use the “Summarize Results” Feature
To use this feature:
-
Run a Query: After selecting your log group(s) and applying the necessary filters in CloudWatch Log Insights, click the Summarize Results button at the bottom of the results panel.
-
View the Summary: CloudWatch will automatically generate a summary of your log data, highlighting the most critical aspects, such as data anomalies, performance bottlenecks, and unusual trends.
-
Investigate Further: If the summary highlights areas of concern, you can dive deeper with the Investigate button, which opens up additional options to analyze your logs further.
Conclusion
With the addition of the Summarize Results feature, CloudWatch Log Insights continues to evolve, making it even easier for cloud administrators, DevOps engineers, and security professionals to manage and analyze their log data. This new feature significantly enhances user experience, improves decision-making, and enables more proactive monitoring of your AWS environment. For anyone working with CloudWatch, this is a valuable addition to your toolkit for efficient log analysis.
Reference/s

🌸 25% OFF All Reviewers on our International Women’s Month Sale! Save 10% OFF All Subscriptions Plans & 5% OFF Store Credits/Gift Cards!

Learn AWS with our PlayCloud Hands-On Labs

$2.99 AWS and Azure Exam Study Guide eBooks

New AWS Generative AI Developer Professional Course AIP-C01

Learn GCP By Doing! Try Our GCP PlayCloud

Learn Azure with our Azure PlayCloud

FREE AI and AWS Digital Courses

FREE AWS, Azure, GCP Practice Test Samplers


Subscribe to our YouTube Channel

Follow Us On Linkedin