Ends in
00
days
00
hrs
00
mins
00
secs
ENROLL NOW

📚 As LOW as $2.99 USD — Buy 1 Take 1 Ebook Sale!

Amazon Quick Sight Sheet Tooltips: Enhancing Data Storytelling and Dashboard UX

Home » AWS » Amazon Quick Sight Sheet Tooltips: Enhancing Data Storytelling and Dashboard UX

Amazon Quick Sight Sheet Tooltips: Enhancing Data Storytelling and Dashboard UX

Modern organizations use data visualization tools for critical decisions. Dashboards simplify complex datasets, turning millions of rows of raw data into digestible formats. Still, users often view a dashboard and feel they aren’t seeing the whole picture.

Dashboards often lack immediate context, resulting in a frustrating user experience. Analysts must constantly switch between views, tabs, and reports just to understand the insights. To solve this, AWS introduced Sheet Tooltips in Amazon Quick Sight, a powerful feature that enables richer, more interactive data storytelling in a single dashboard view.

Amazon Quick Sight Sheet Tooltips - Enhancing Data Storytelling and Dashboard UX

The Problem with Traditional Dashboards

While business intelligence (BI) has evolved significantly, traditional dashboard design still suffers from several major usability bottlenecks:
  • Fragmented insights: Users must navigate multiple sheets to gain context for a data point.
  • Too many clicks: Constant drill-downs and filter menus interrupt the natural flow of analysis.
  • Cognitive overload: Forcing users to interpret multiple dense visuals separately can overwhelm them and obscure the main narrative.
  • Static tooltips: Traditional hover-overs only show basic values (like a single text string or number) rather than actionable, layered insights.
The Bottom Line: Traditional dashboards are great at showing you what is happening, but they consistently fail to explain why.


What is Amazon Quick Sight?

Amazon Quick is the rebrand of Amazon QuickSight. It is now positioned as a unified analytics platform powered by generative AI. It retains all the familiar BI features for building dashboards and exploring data. Amazon Quick also introduces advanced AI-driven tools that simplify analytics, automate tasks, and empower users of any skill level. In this new ecosystem, Amazon Quick Sight (now stylized with a space) serves as the core BI and data visualization component.
 
Amazon Quick

It empowers teams to build interactive dashboards, perform ad-hoc analyses, and seamlessly share insights across the organization. Some of its heavy-hitting features include:

  • SPICE Engine:
    • The Super-fast, Parallel, In-memory Calculation Engine designed for blazing-fast data retrieval.
  • Auto-scaling Architecture
    • Fully serverless, meaning it scales automatically without requiring infrastructure management.
  • Deep AWS Integration
    • Natively connects with S3, RDS, Redshift, and various third-party data sources.


How Standard Tooltips Work

Before diving into the new sheet tooltips, it is helpful to review how standard tooltips currently function in the Amazon Quick Sight ecosystem.

When you hover your cursor over any graphical element in a visual, like a date on a line chart, a basic tooltip pops up. It provides information about that specific element. By default, the information in this tooltip is determined by the data mapped in your “Fields well.”

If you use the “Detailed tooltip” option, you get a bit more control over this setup:

  • You can display the primary field value as the tooltip title
  • You can choose to display the mathematical aggregations (such as sums or averages) applied to the fields
  • You can manually add and customize labels for up to 10 data fields that appear on hover
Standard tooltips are great for getting an exact number from a graph. They do this without cluttering the screen. Yet, they are ultimately limited to a static list of text values. This is where the need for a more dynamic, visual solution materializes.
 

Amazon Quick Sight Sheet Tooltips

Introduced in April 2026, Sheet Tooltips make hover interactions much richer. Instead of displaying a text box, this feature lets developers embed an entire Amazon Quick Sight sheet into the tooltip—essentially a mini-dashboard displayed directly in the tooltip.

When a user hovers over a data point:

  • A rich, contextual canvas appears instantly.
  • Tutorials dojo strip
  • The pop-up can include multiple charts, key performance indicators (KPIs), text boxes, and even images.
Traditional tooltips are static data labels. Sheet tooltips deliver a dynamic, filtered visual experience. They turn your dashboard from a simple display of numbers into an interactive storytelling panel.
 

How Sheet Tooltips Work

Amazon Quick Sight Sheet Tooltip

The mechanics behind sheet tooltips rely on dynamic contextual filtering. Here is the step-by-step technical breakdown of how it operates in real-time:
  • Step 1: Hover Interaction

    • A user hovers their cursor over a specific data point on the main dashboard. For example, this could be a bar representing the “Asia” region. Amazon Quick Sight instantly captures the contextual dimension values at that exact coordinate.
  • Step 2: Filter Inheritance

    • The tooltip sheet inherits all active filters from the main visual. It then applies an extra filter for the data point you hovered over. For example, hovering on “Asia” filters all visuals inside the tooltip to Asian data.
  • Step 3: Rendering the Tooltip Sheet

    • The engine loads the visual elements—charts, text, and images—defined for that tooltip sheet. Data is processed rapidly via the in-memory SPICE engine or via Direct Query.
  • Step 4: Contextual Insight Display

    • The tooltip instantly displays detailed breakdown charts, KPIs, and historical trends. The system reuses existing dashboard logic. It then applies on-the-fly context-specific filtering.


Real-World Use Cases Across Industries

Let’s put this into perspective. Sheet tooltips are versatile and work well in nearly any industry. They deepen analytical value without cluttering the main screen. Here are some examples:
  • Financial & Executive Dashboards: Executives often need a macro view of the business. A main dashboard might show overarching revenue by region. When the executive hovers over the “North America” bar, a sheet tooltip pops up. It instantly displays a line chart of month-over-month trends, a pie chart showing revenue by department, and a gauge chart comparing actuals to quarterly targets.
  • Healthcare & Patient Analytics: A hospital’s population health dashboard might display a key metric, such as the overall readmission rate. When a care manager hovers over a high-risk facility, a tooltip sheet pops up. It details patient demographics, localized utilization metrics, and specific risk gaps for that location. This enables immediate, proactive intervention.
  • Supply Chain & Operational Monitoring: Logistics teams tracking global operations can view a map of all distribution centers. Hovering over a specific warehouse location reveals a mini-dashboard displaying current inventory volume, average delivery latency metrics, and a list of the top delayed products.
In all these cases, users gain instant, layered root-cause analysis—uncovering trends without leaving their primary view.
 

Step-by-Step: How to Build Your First Sheet Tooltip

Here is a practical, step-by-step guide on how to implement a sheet tooltip directly within the Amazon Quick console:
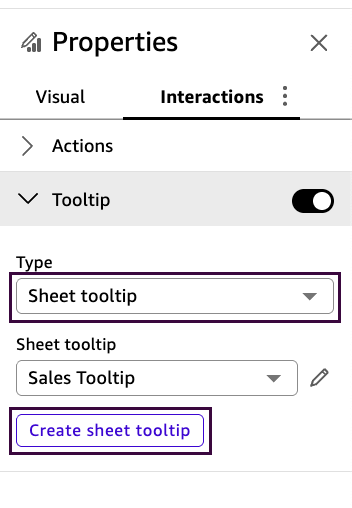
  • Step 1: Navigate to Interactions

    • Open your analysis in the console, then select the visual you want to enhance (e.g., a bar chart). Click the Format visual icon. In the Properties panel on the right, go to the Interactions tab.
  • Step 2: Enable Sheet Tooltips

    • Under the Tooltip configuration, look for the Type dropdown and select ‘sheet tooltip’.

         Sheet Tooltip Properties

  • Step 3: Create the Sheet

    • Click the Create sheet tooltip button. Amazon Quick Sight opens a new, blank tooltip sheet using a free-form layout canvas.
  • Step 4: Design Your Mini-Dashboard

    • Add supplementary visuals. You can drop in up to 5 visuals, 5 text boxes, and 5 images. Resize and arrange them as you want in the hover window.
  • Step 5: Return and Test

    • Once you are happy with the layout, click the < (Back) button at the top menu bar. This returns you to the main dashboard.
      Now, you can hover over your visual to see your custom, dynamic tooltip in action.


Advanced Capabilities: Small Multiples and Parameters

Once you understand the basic mechanics of embedding a sheet tooltip, you can push the boundaries of data storytelling by integrating two of Amazon Quick Sight’s most powerful analytical features:
  • Small Multiples Support

    • Sheet tooltips natively integrate with visuals, utilizing the small multiples feature. Small multiples split a visual into a grid of comparative partitions. By attaching a sheet tooltip to this grid, viewers can hover over an individual panel to uncover highly localized, detailed context for that specific partition without losing their macroscopic comparative view.
  • Parameter-Driven Tooltip Switching

    • To take progressive disclosure to its absolute peak, sheet tooltips support parameter-driven interactivity. This allows dashboard authors to create dynamic tooltips where the reader uses a control on the main canvas to literally switch which visuals render inside the tooltip. For instance, a reader can toggle a parameter to instantly swap the tooltip’s display from a “Sales by Quarter” breakdown to a “Sales by Category” view.


The Core Benefits of Sheet Tooltip

Implementing sheet tooltips provides several immediate advantages for enterprise reporting:
  • Fewer Sheets to Manage:

    • It drastically reduces the need to build and maintain multiple drill-down dashboards, consolidating macroscopic and microscopic insights into a single interface.
  • Better User Experience (UX):

    • Less navigation translates to smoother interaction. It surfaces vital functionality directly within the flow of the user’s natural interaction, keeping them focused on one visual context.
  • Faster Decision-Making:

    • Sheet tooltips give instant access to deeper, layered insights. Users spend less time clicking through filters and switching views.
  • Improved Data Storytelling:

    • It executes the psychological principle of progressive disclosure. It combines summary and detail seamlessly, helping users understand cause and effect without suffering from cognitive overload.


The Limitations of Sheet Tooltip

As powerful as sheet tooltips are, they are not a universal solution for every reporting scenario. When architecting your dashboard, it is critical to adhere to the following technical constraints enforced by the platform:
Free AWS Courses
  • Capacity and Dimension Limits:

    • Up to 50 tooltip sheets per analysis
    • Up to 5 visuals per tooltip sheet
    • Up to 5 text boxes per tooltip sheet
    • Up to 5 images per tooltip sheet
    • The maximum size of a tooltip sheet is 640px wide by 720px tall
    • Tooltip sheets use only the free-form layout
  • Cross-Sheet Filtering:

    • Cross-sheet filters cannot be scoped to tooltip sheets
  • Minimum Sheet Requirement:

    • An analysis must contain at least one regular interactive sheet. It cannot consist solely of tooltip sheets
  • Unsupported Visual Types:

To ensure tooltip sheets load quickly and maintain a focused experience, certain complex visuals cannot host or be placed inside a sheet tooltip. The following visual types are strictly excluded:

    • Sankey diagrams
    • Waterfall charts
    • KPIs
    • Radar charts
    • Wordclouds
    • Custom content visuals
    • Highcharts
    • Insights
    • Layer map visuals


From Static to Interactive UI Dashboards

Sheet tooltips represent a massive shift from static, traditional dashboards to highly interactive, layered storytelling systems. By embracing progressive disclosure, they remove friction in data analysis and embed dynamically filtered, contextually relevant insights right where the user is already looking.

When used properly, they clear up visual clutter, drastically reduce manual sheet navigation, and enable lightning-fast, data-driven decisions. As enterprise dashboards continue to evolve, features like sheet tooltips prove that the future of BI isn’t just about displaying data—it’s about letting users intuitively experience insights in perfect context.


References:

Check out more on Tech Blogs here: Tutorials Dojo Tech Blogs

📚 As LOW as $2.99 USD — Buy 1 Take 1 Ebook Sale!

Tutorials Dojo portal

Learn AWS with our PlayCloud Hands-On Labs

$2.99 AWS and Azure Exam Study Guide eBooks

tutorials dojo study guide eBook

New AWS Generative AI Developer Professional Course AIP-C01

AIP-C01 Exam Guide AIP-C01 examtopics AWS Certified Generative AI Developer Professional Exam Domains AIP-C01

Learn GCP By Doing! Try Our GCP PlayCloud

Learn Azure with our Azure PlayCloud

FREE AI and AWS Digital Courses

FREE AWS, Azure, GCP Practice Test Samplers

SAA-C03 Exam Guide SAA-C03 examtopics AWS Certified Solutions Architect Associate

Subscribe to our YouTube Channel

Tutorials Dojo YouTube Channel

Follow Us On Linkedin

Written by: Cristieneil Ceballos

Cristieneil Ceballos, “Cris” for short, is a Computer Science student at the University of the Philippines Mindanao and an IT Intern at Tutorials Dojo. Passionate about continuous learning, she volunteers and engages with various tech communities—viewing each experience as both a chance to contribute and an opportunity to explore areas she’s interested in.

AWS, Azure, and GCP Certifications are consistently among the top-paying IT certifications in the world, considering that most companies have now shifted to the cloud. Earn over $150,000 per year with an AWS, Azure, or GCP certification!

Follow us on LinkedIn, YouTube, Facebook, or join our Slack study group. More importantly, answer as many practice exams as you can to help increase your chances of passing your certification exams on your first try!

View Our AWS, Azure, and GCP Exam Reviewers Check out our FREE courses

Our Community

~98%
passing rate
Around 95-98% of our students pass the AWS Certification exams after training with our courses.
200k+
students
Over 200k enrollees choose Tutorials Dojo in preparing for their AWS Certification exams.
~4.8
ratings
Our courses are highly rated by our enrollees from all over the world.

What our students say about us?