Last updated on April 28, 2023
What is Grafana?
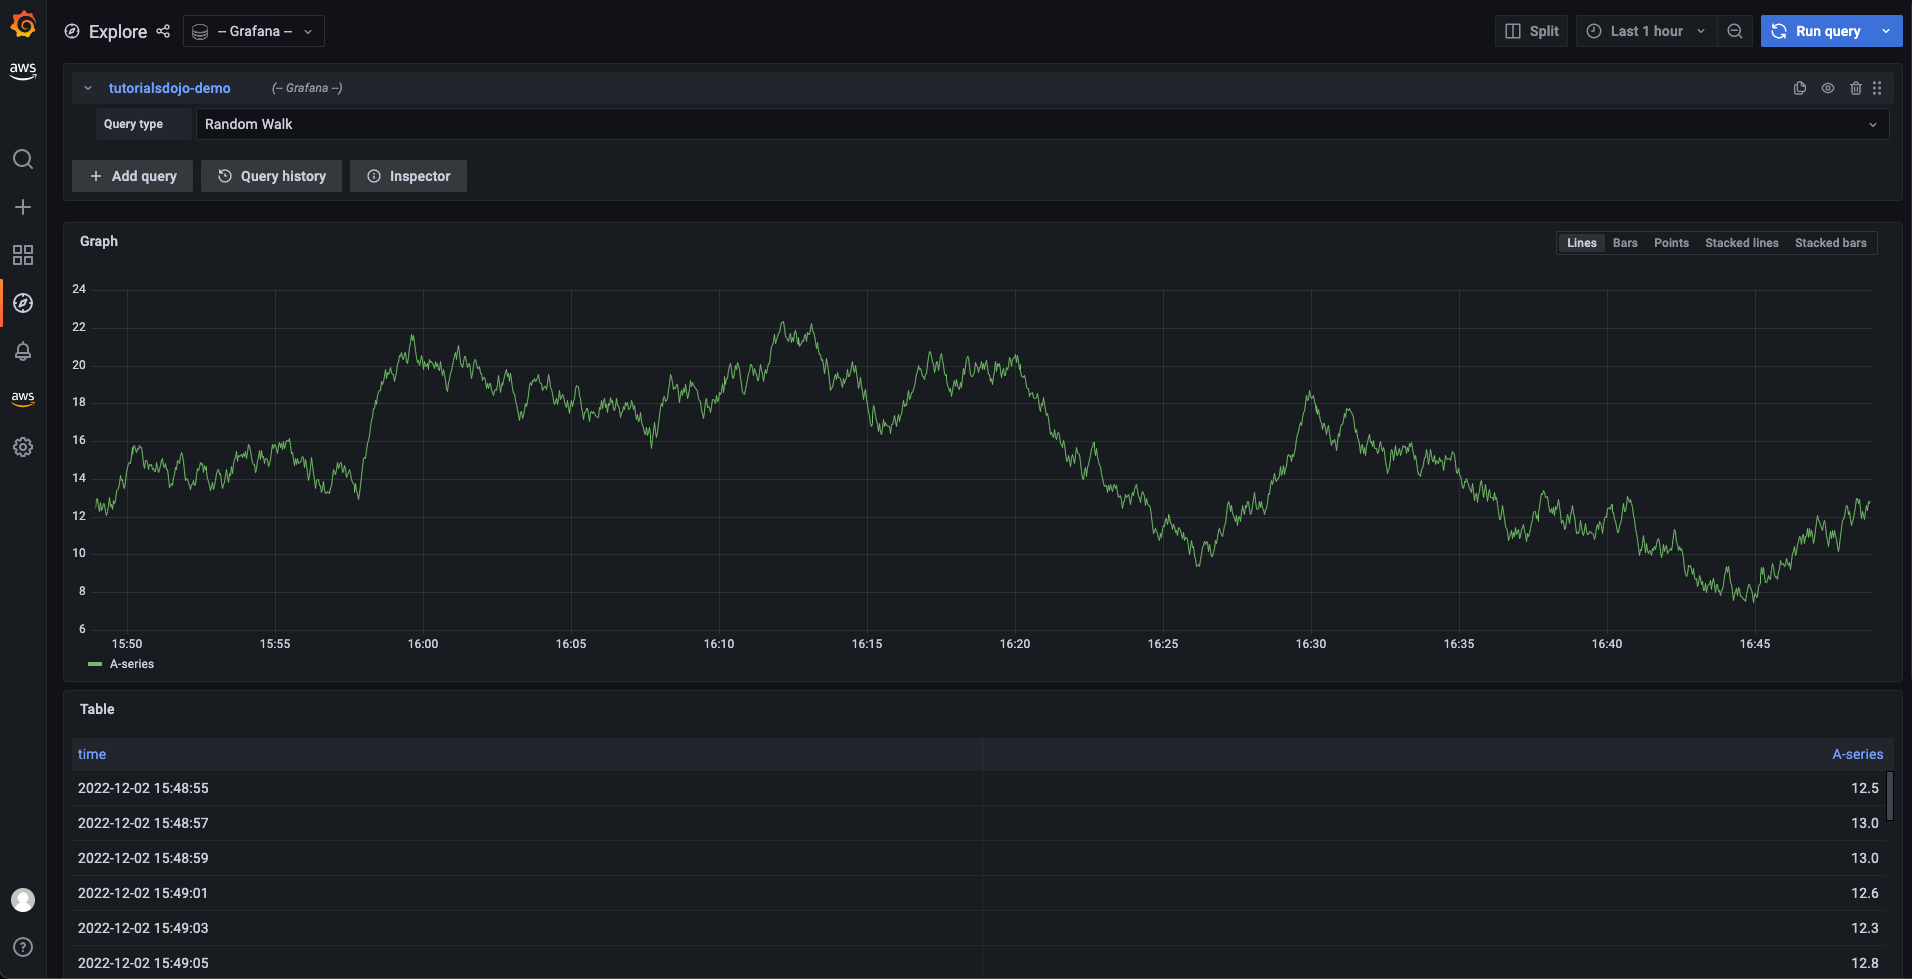
Grafana is an open-source analytics and interactive visualization web app. When connected to supported data sources, it displays charts, graphs, and alerts on the web. The product is described as a “complete observability stack,” which includes everything you need to interact with your data.
How It Works
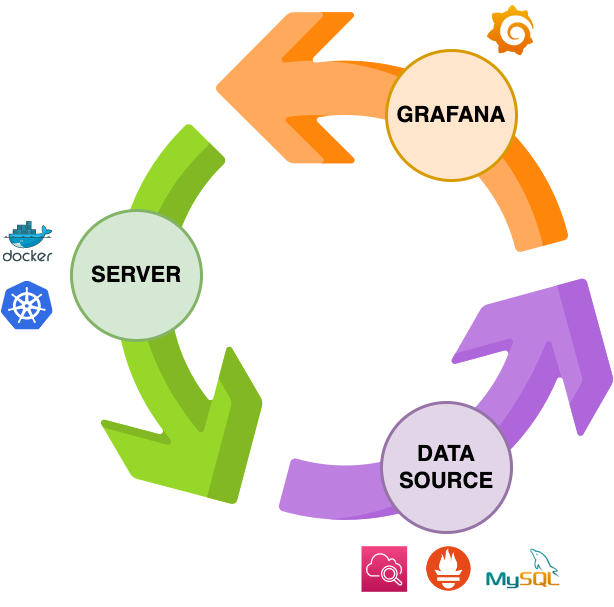
To visualize and analyze data in a dashboard, you’ll need to set up the following:
-
Server – produces the data that you want to visualize.
-
Data Source – a connection set up to a database from a server.
-
Grafana – queries the data source for information to display in the dashboard.
Grafana Key Features:
-
Each dashboard is made up of modular panels that are linked to data sources. A single dashboard can display metrics from multiple sources at the same time, allowing you to track your entire stack from a single view.
-
Plugins allow you to use APIs to connect to existing data sources and render the data in real-time, eliminating the need for you to migrate or ingest your data.
-
You can also set up alerts to learn about problems in your systems as soon as they occur.
-
Transformations allow you to rename, summarize, combine, and calculate data from multiple queries and data sources.
-
Adding annotations (description and tags) will make it searchable from other dashboards.
-
The panel editor makes it simple to configure, customize, and explore all of your panels by providing a consistent UI for configuring data options across all of your visualizations.
What is Amazon Managed Grafana?
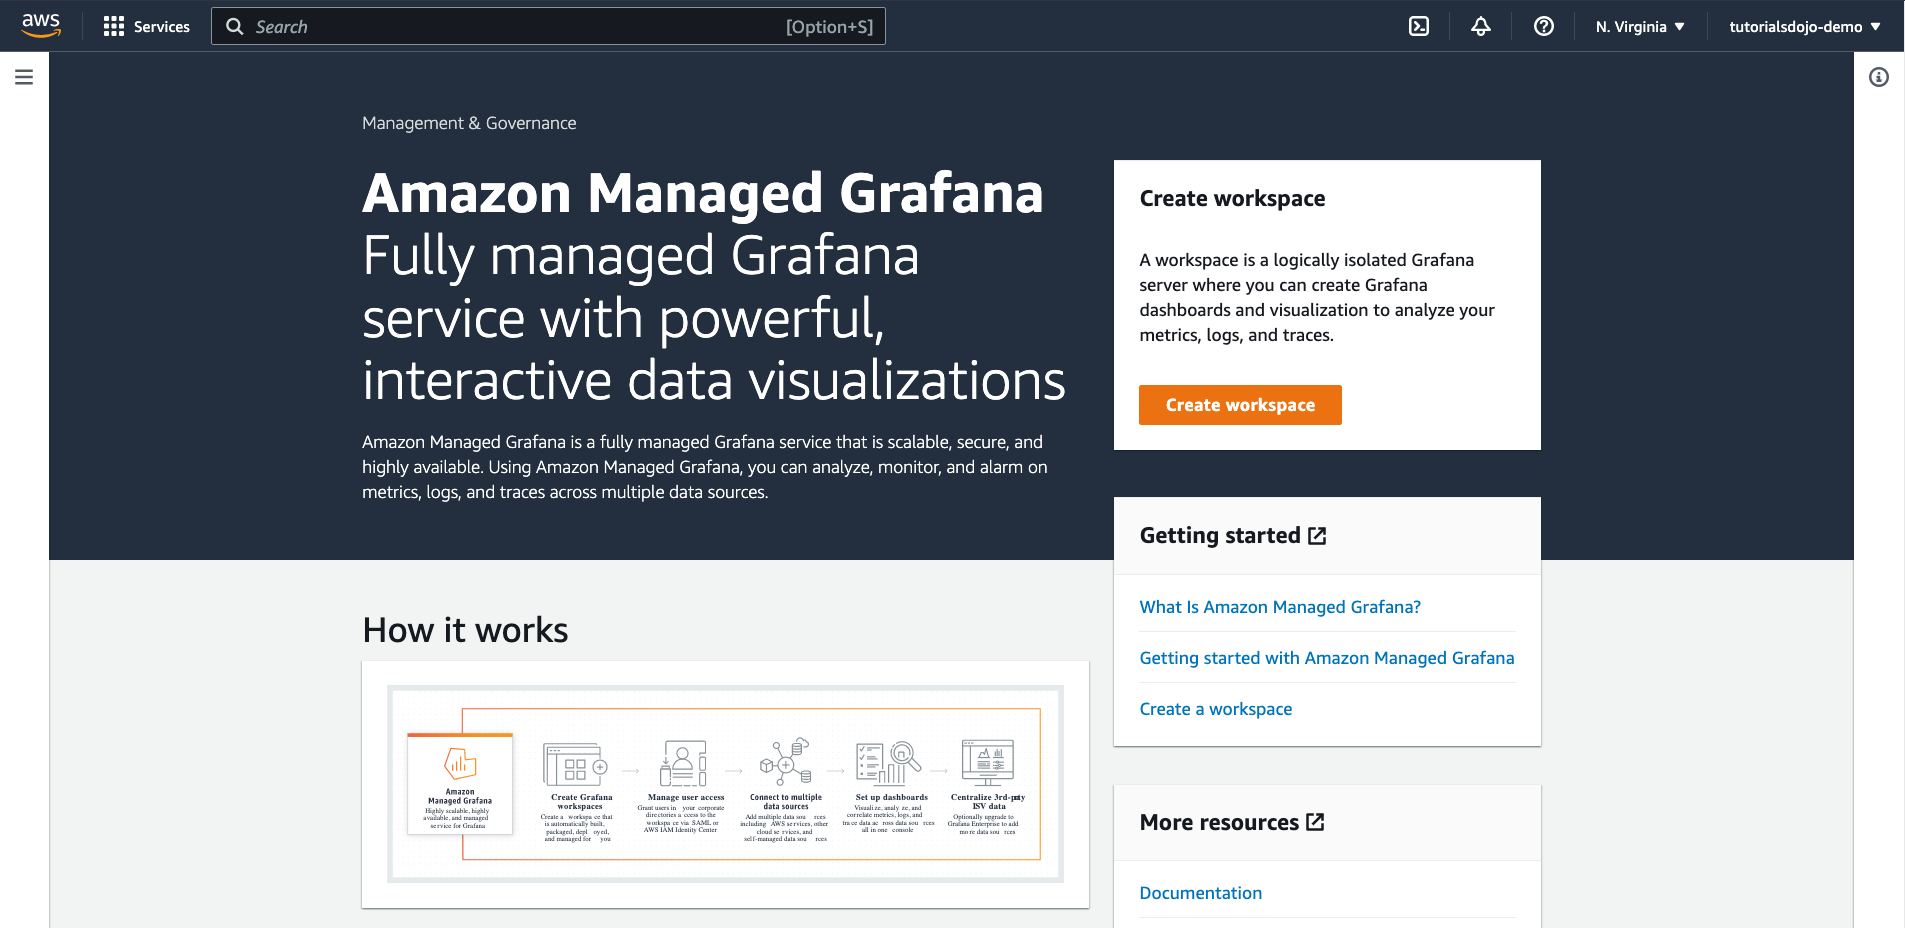
In AWS, there is a managed service called Amazon Managed Grafana. It works the same way as the open-source tool Grafana, but AWS already manages the server. This service can easily monitor and analyze your AWS containers and IoT resources.
Here are a few of its amazing features::
-
Visualize and correlate data across multiple data sources.
-
Share dashboards easily with user authentication and authorization.
-
Automatic recovery and patching.
-
No servers to manage.
To know more about this service, you might want to check out this Tutorials Dojo Grafana cheat sheet. It is a summary of the features, components, and pricing from the AWS documentation.
Final Remarks
Grafana dashboards make monitoring multiple infrastructures a breeze. Since you can quickly determine whether your stack is operating normally and you can gain real-time insights without having to sift through data points manually.
Interested in getting your hands dirty with Grafana? You can use their sandbox to learn about its awesome features and create visually appealing dashboards without paying a single cent.

